Glass sphere
Every chart drawn in this format, newest first. How it reads: Methodology.
-
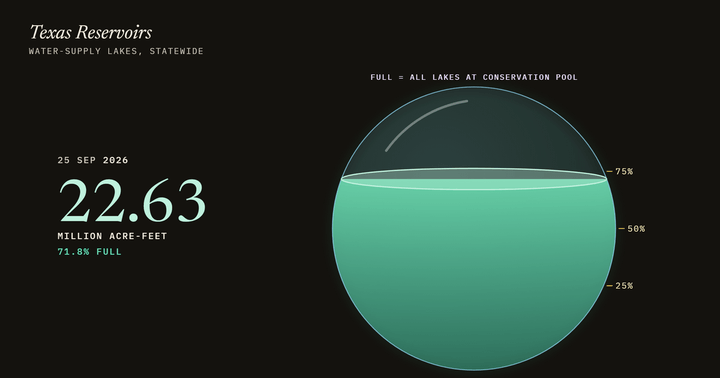
Texas Reservoirs, 1950–2026
Texas's water-supply reservoirs as a glass sphere, month by month from the drought of the 1950s to today.
Updated 25 September 2026 -
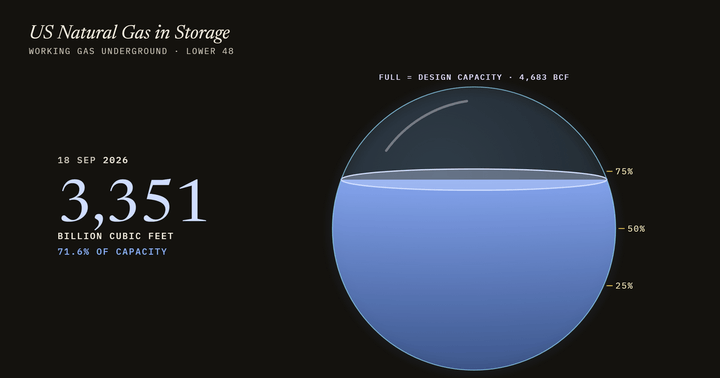
US Natural Gas in Storage, 2010–2026
The natural gas stored underground in the Lower 48 states as a glass sphere, filling every summer and drawn down every winter, week by week since 2010.
Updated 18 September 2026 -
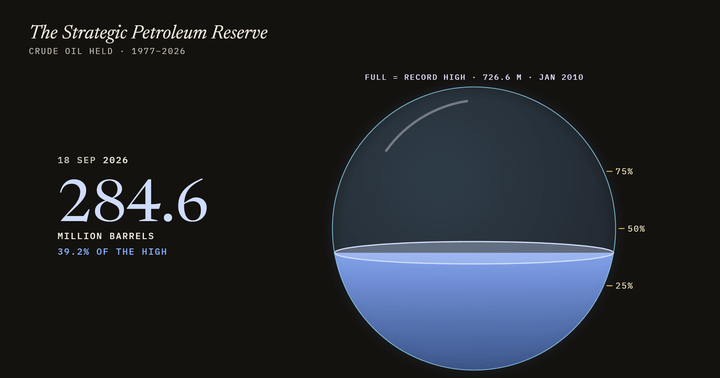
The Strategic Petroleum Reserve, 1977–2026
The US Strategic Petroleum Reserve as a glass sphere, filling from its first barrels in 1977 to its 2010 high and draining since, week by week.
Updated 18 September 2026 -
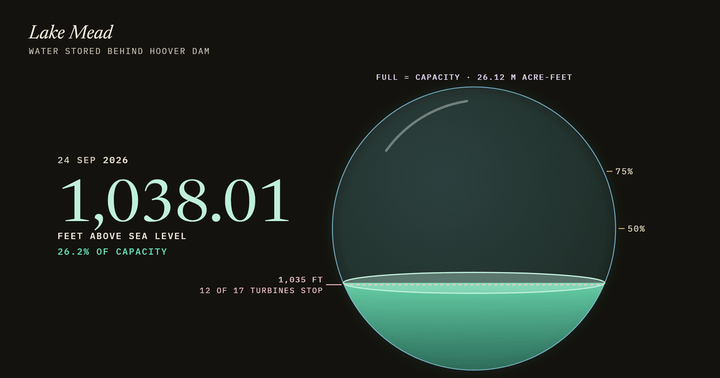
Lake Mead's Water Level, 1935–2026
Lake Mead as a glass sphere filling and draining month by month since 1935, with a dashed line at 1,035 feet, below which most of Hoover Dam's turbines cannot run.
Updated 24 September 2026