All visualizations
Newest first. Each piece lists its sources and method.
-
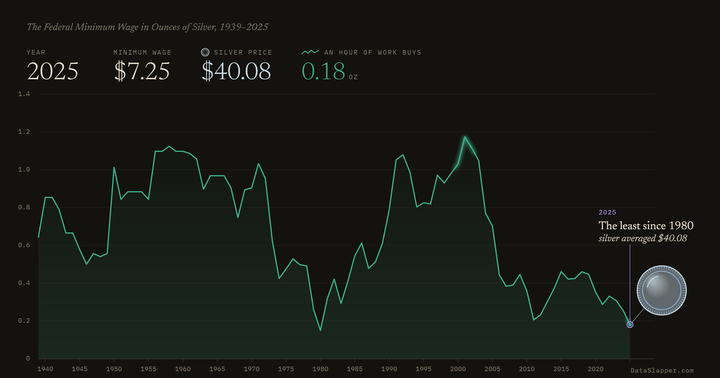
The Federal Minimum Wage in Ounces of Silver, 1939–2025
One hour at the federal minimum wage priced in silver, 1939–2025: 1.17 ounces at the 2001 high, and 0.18 in 2025, the least since 1980.
Updated 2025 -
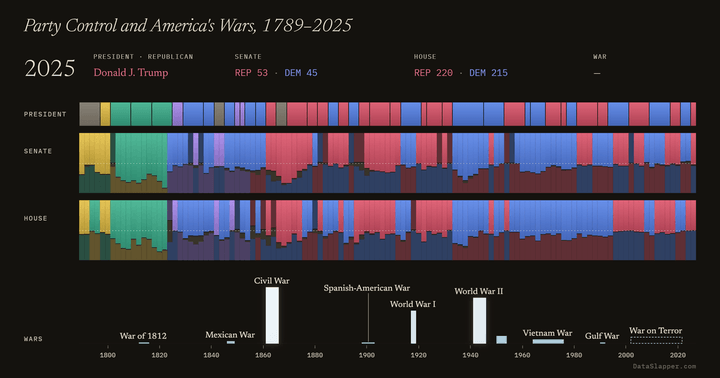
Party Control and America's Wars, 1789–2025
Who held the White House, the Senate and the House in every Congress since 1789, set against the dates and U.S. deaths of America's major wars.
Updated 2025 -
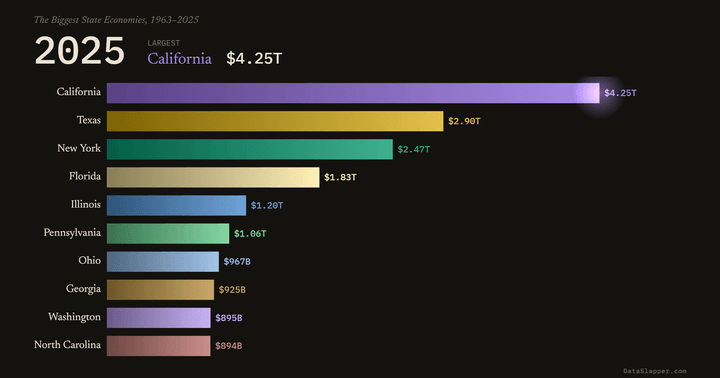
The Biggest State Economies, 1963–2025
The ten largest US state economies, year by year since 1963: California passes New York in 1971, and Texas passes New York in 2006.
Updated 2025 -
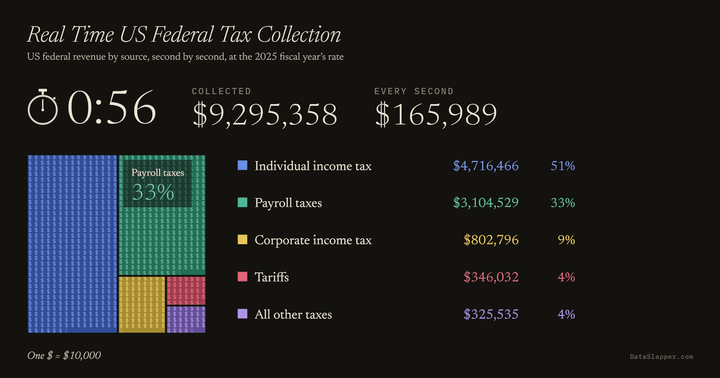
Real Time US Federal Tax Collection
Federal taxes collected as a clock runs, $165,989 every second: half from individual income tax, a third from payroll taxes.
Updated 2025 -
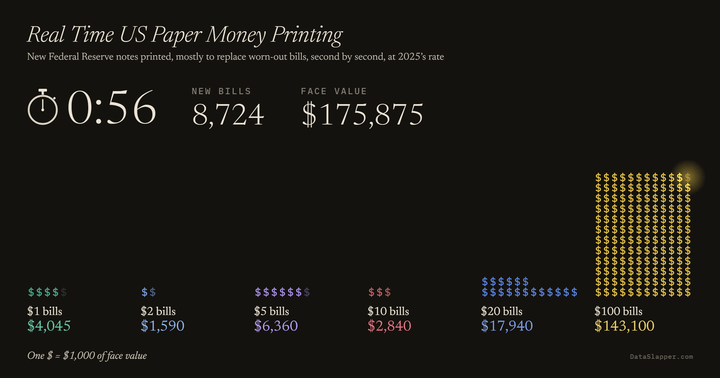
Real Time US Paper Money Printing
New US bills printed as a clock runs, a dollar sign for every ten: $1 bills lead the count, $100 bills the value.
Updated 2025 -
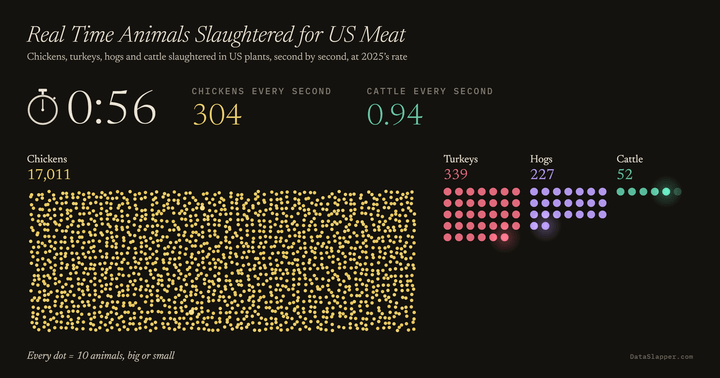
Real Time Animals Slaughtered for US Meat
Animals slaughtered for US meat as a clock runs, ten to a dot: about 304 chickens every second against one head of cattle.
Updated 2025 -
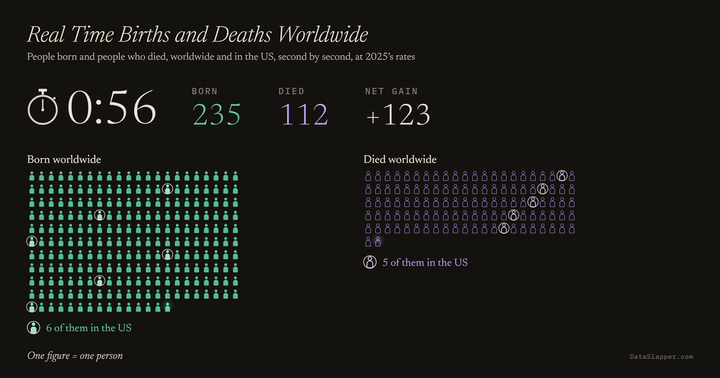
Real Time Births and Deaths Worldwide
Births and deaths around the world as a clock runs, one figure per person: about two born for every one who dies.
Updated 2025 -
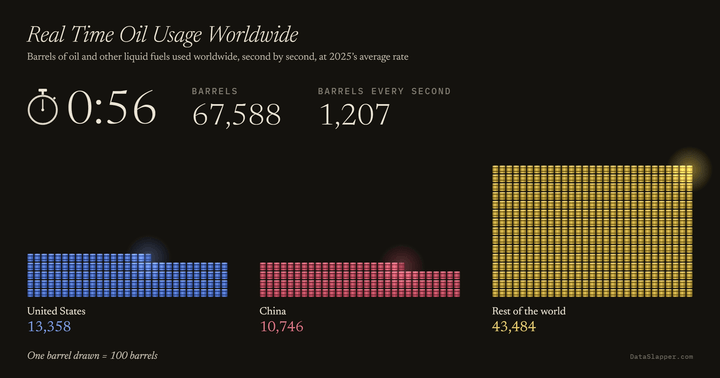
Real Time Oil Usage Worldwide
Barrels of oil the world uses as a clock runs, at 2025's rate of 1,207 a second: the US and China, then everyone else.
Updated 2025 -
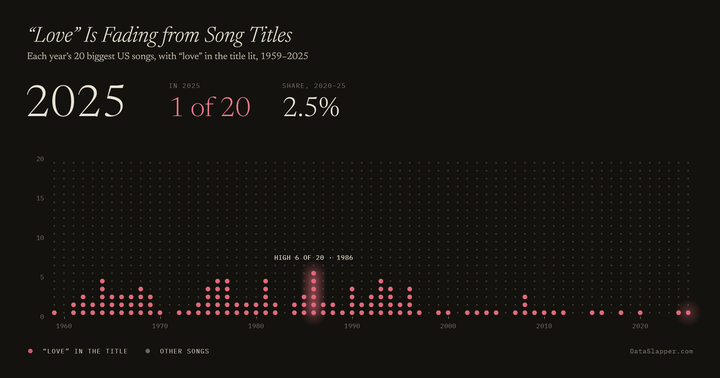
“Love” Is Fading from Song Titles, 1959–2025
How many of America's 20 biggest songs each year have "love" in the title, 1959–2025: about one in eight through the 1990s, 3 of 120 since 2020.
Updated 2025 -
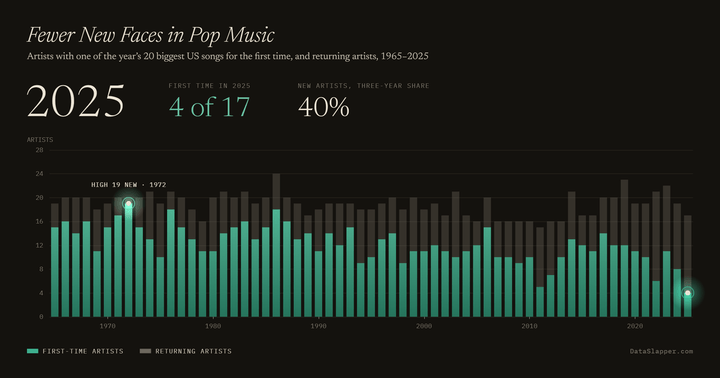
Fewer New Faces in Pop Music, 1965–2025
How many of the artists behind America's 20 biggest songs each year were there for the first time, 1965–2025: 19 of 20 in 1972, 4 of 17 in 2025.
Updated 2025 -
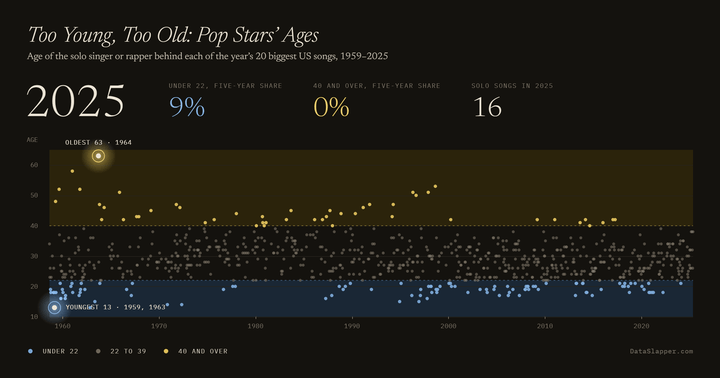
Too Young, Too Old: Pop Stars’ Ages, 1959–2025
The age of the solo star behind each of America's 20 biggest songs of the year, 1959–2025: teenagers and 60-year-olds in the 1960s, nobody 40 or over since 2017.
Updated 2025 -
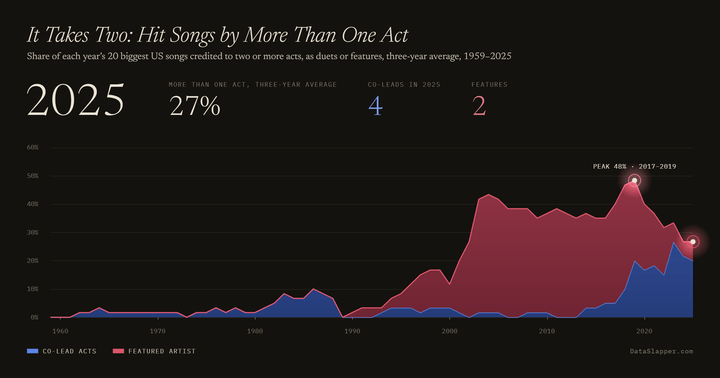
It Takes Two: Hit Songs by More Than One Act, 1959–2025
The share of America's 20 biggest songs each year credited to two or more acts, as duets or features, 1959–2025: rare in the 1960s, nearly half by the late 2010s.
Updated 2025 -
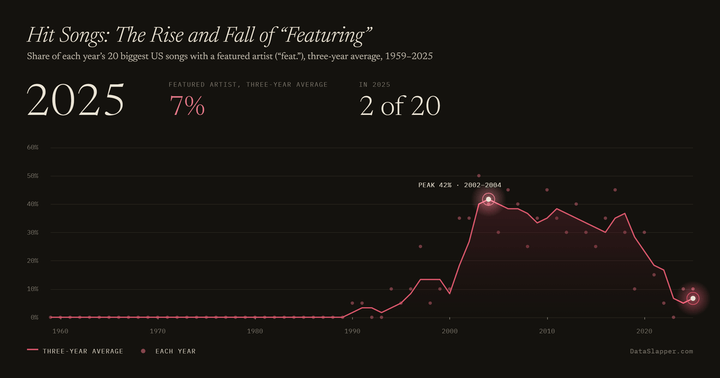
Hit Songs: The Rise and Fall of “Featuring”, 1959–2025
How many of America's 20 biggest songs each year credit a featured artist, 1959–2025: none before 1990, about four in ten in the early 2000s, and few today.
Updated 2025 -
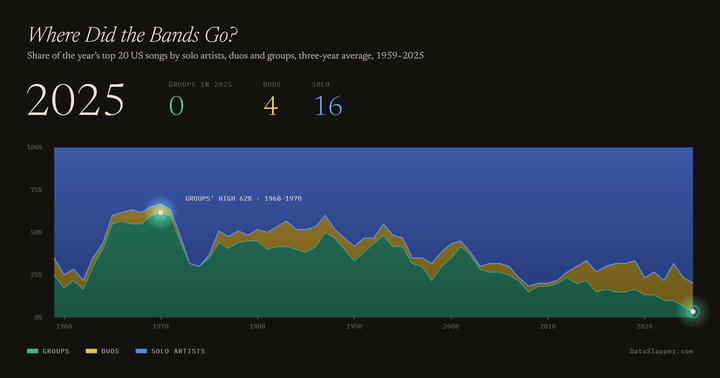
Where Did the Bands Go? 1959–2025
America's top 20 hits by solo artists, duos and groups, 1959–2025: groups had most of them in the late 1960s and none in 2025.
Updated 2025 -
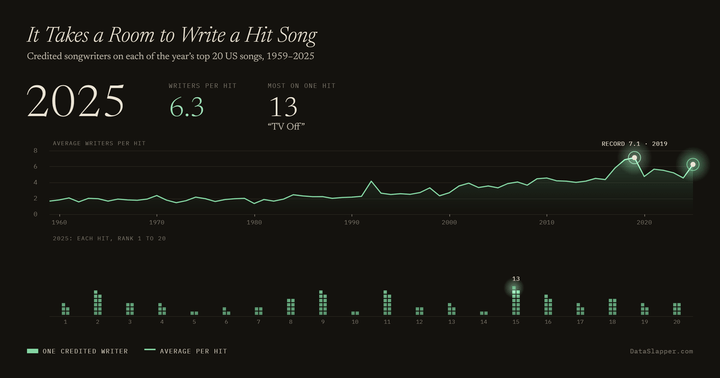
It Takes a Room to Write a Hit Song, 1959–2025
The credited songwriters on America's top 20 hits, 1959–2025, from under two per song in 1959 to more than six today.
Updated 2025 -
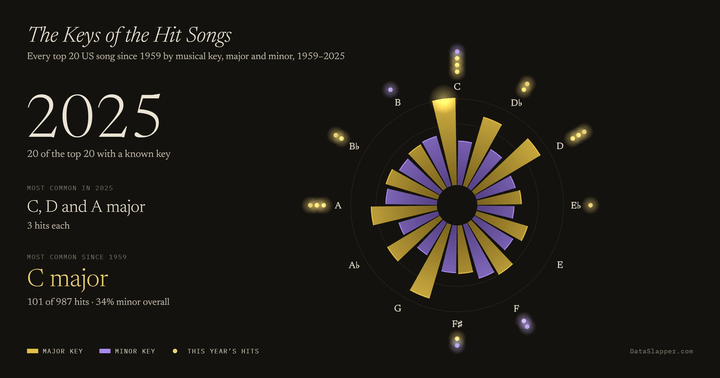
The Keys of the Hit Songs, 1959–2025
Every top 20 hit since 1959 on a wheel of the twelve keys, major and minor, building year by year; C major leads.
Updated 2025 -
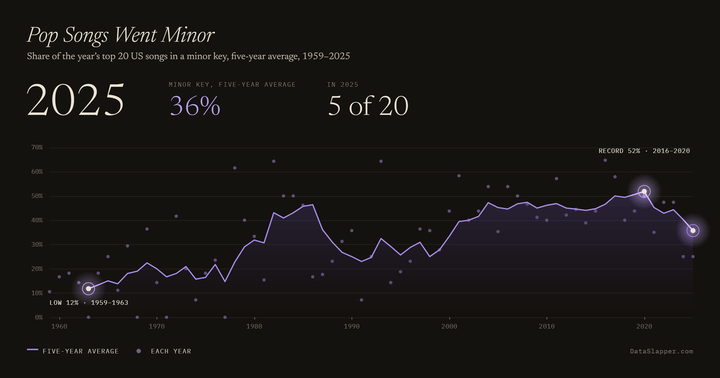
Pop Songs Went Minor, 1959–2025
The share of America's top 20 hits written in a minor key, 1959–2025, from about one in eight in the early 1960s to more than half in the late 2010s.
Updated 2025 -
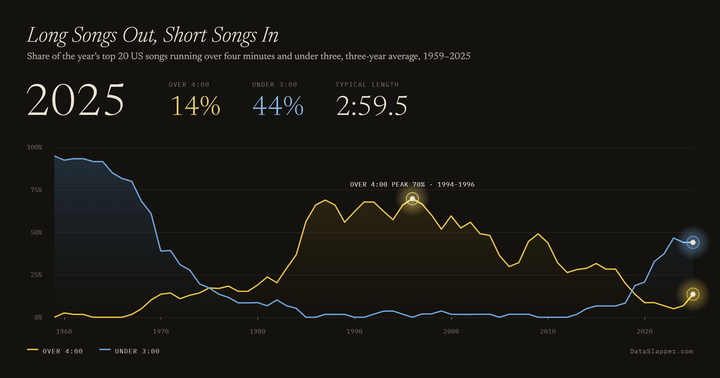
Long Songs Out, Short Songs In, 1959–2025
How long America's biggest hits run, 1959–2025: songs over four minutes rose to 70 percent in the 1990s, and songs under three minutes are back.
Updated 2025 -
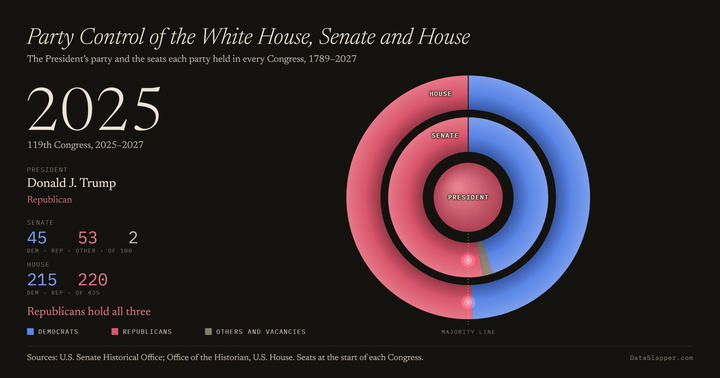
Party Control of the White House, Senate and House, 1789–2027
The President's party and every party's seats in the Senate and House, Congress by Congress since 1789, as a bullseye of three rings.
Updated the 119th Congress (2025–2027) -
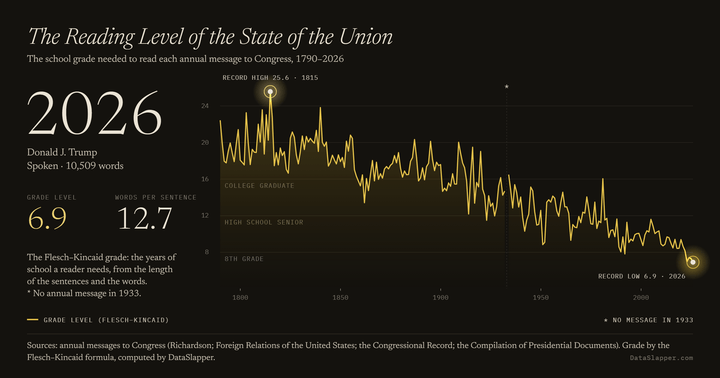
The Reading Level of the State of the Union, 1790–2026
The Flesch–Kincaid reading grade of every State of the Union message since 1790, from beyond a college graduate in the 1800s to 6.9 in 2026.
Updated 2026 -
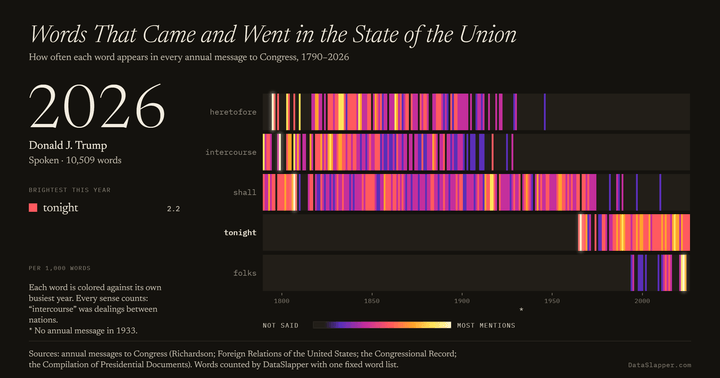
Words That Came and Went in the State of the Union, 1790–2026
How often five words, from heretofore and intercourse to tonight and folks, appear in every State of the Union message since 1790, as a grid that lights each word against its own busiest year.
Updated 2026 -
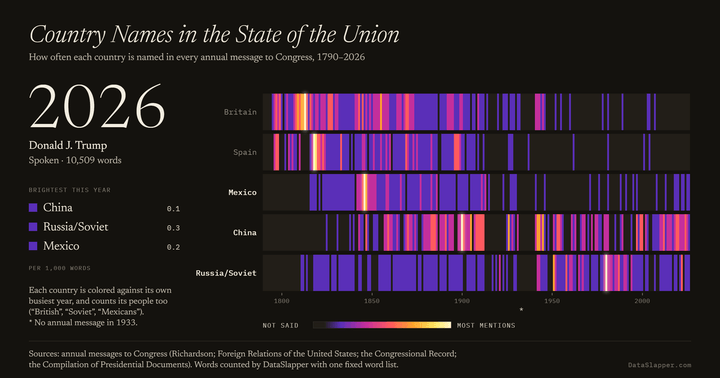
Country Names in the State of the Union, 1790–2026
How often Britain, Spain, Mexico, China and Russia are named in every State of the Union message since 1790, as a grid that lights each country against its own busiest year.
Updated 2026 -
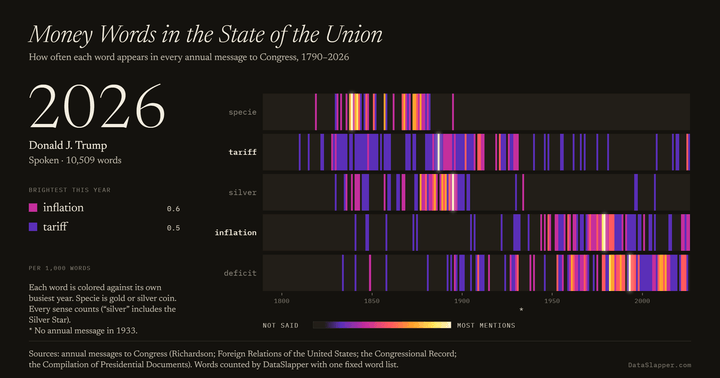
Money Words in the State of the Union, 1790–2026
How often five words, from specie and silver to inflation and deficit, appear in every State of the Union message since 1790, as a grid that lights each word against its own busiest year.
Updated 2026 -
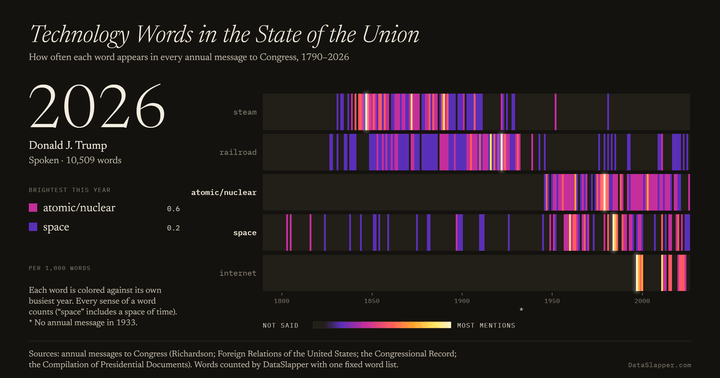
Technology Words in the State of the Union, 1790–2026
How often five words, from steam and railroad to space and the internet, appear in every State of the Union message since 1790, as a grid that lights each word against its own busiest year.
Updated 2026 -
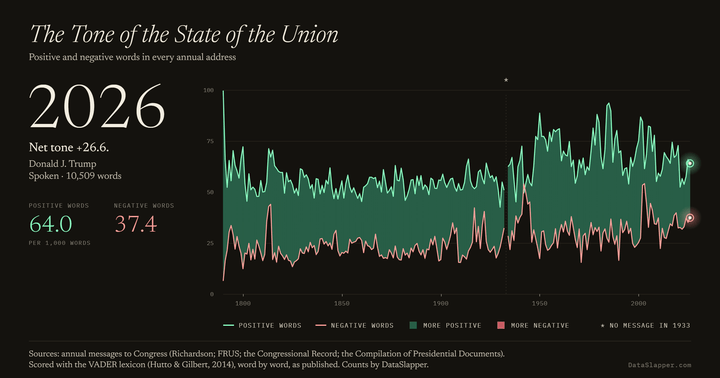
The Tone of the State of the Union, 1790–2026
Positive and negative words in every State of the Union message since 1790, as the VADER word list rates them, drawn as two lines with the gap colored by whichever leads.
Updated 2026 -
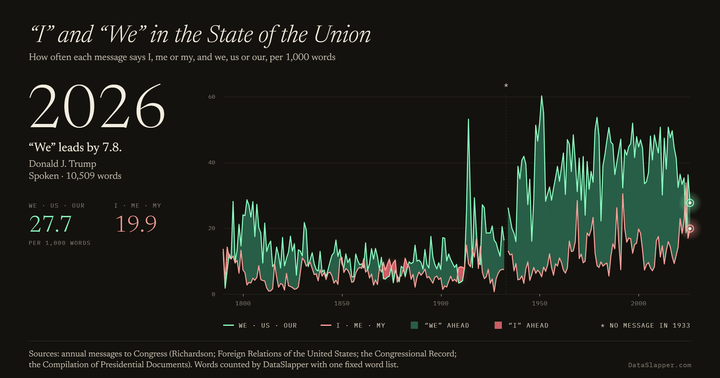
“I” and “We” in the State of the Union, 1790–2026
How often every State of the Union message since 1790 says “I” and how often “we”, as two lines with the gap colored by whichever leads.
Updated 2026 -
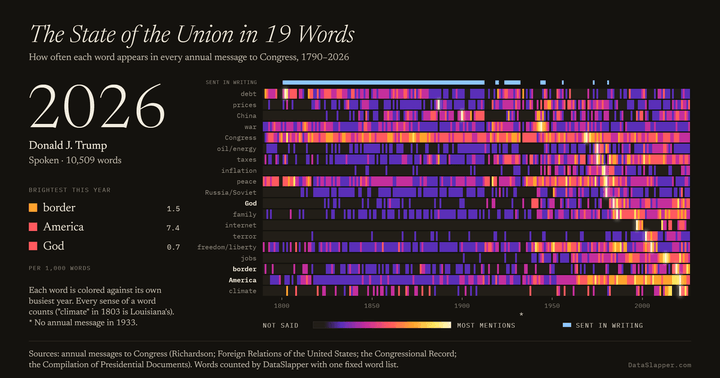
The State of the Union in 19 Words, 1790–2026
How often 19 words, from war and debt to jobs and climate, appear in every State of the Union message since 1790, as a grid that lights each word against its own busiest year.
Updated 2026 -
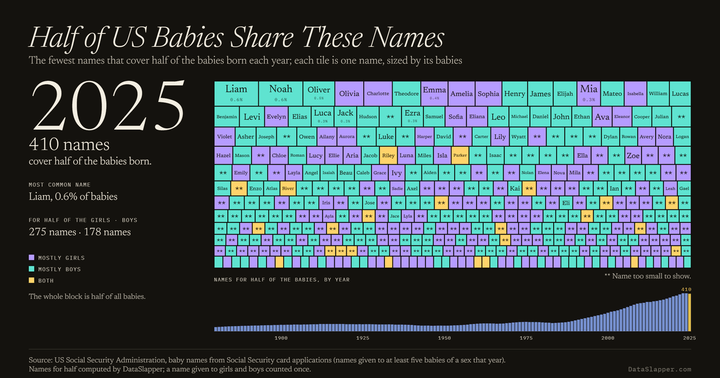
Half of US Babies Share These Names, 1880–2025
The fewest first names that cover half of US babies each year, from 45 in 1880 to 410 in 2025, as a mosaic of name tiles that glide into place.
Updated 2025 -
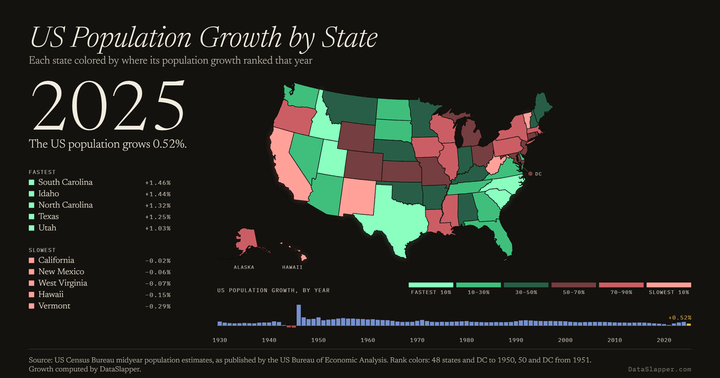
US Population Growth by State, 1930–2025
Every state's population growth, ranked each year from 1930 to 2025 — the fastest in mint, the slowest in coral — above a bar of the nation's growth.
Updated 2025 -
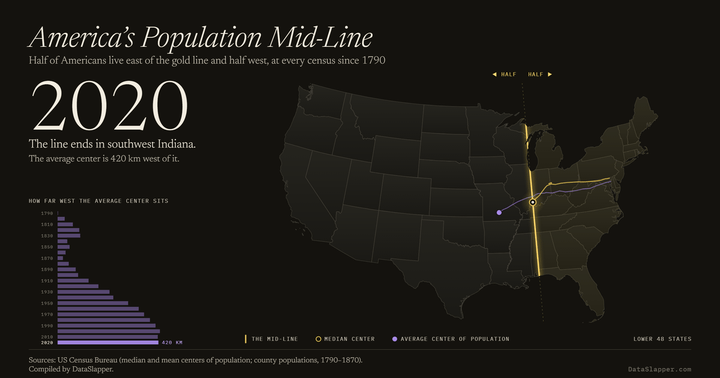
America's Population Mid-Line, 1790–2020
The line with half of Americans on each side, at every census since 1790 — from just east of Baltimore into southwest Indiana — as the average center runs off toward Missouri.
Updated 2020 -
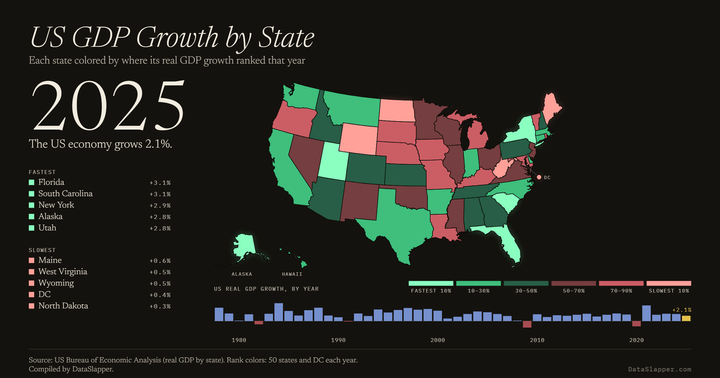
US GDP Growth by State, 1978–2025
Every state's growth in real GDP, ranked each year from 1978 to 2025 — the fastest in mint, the slowest in coral — above a bar of the nation's growth.
Updated 2025 -
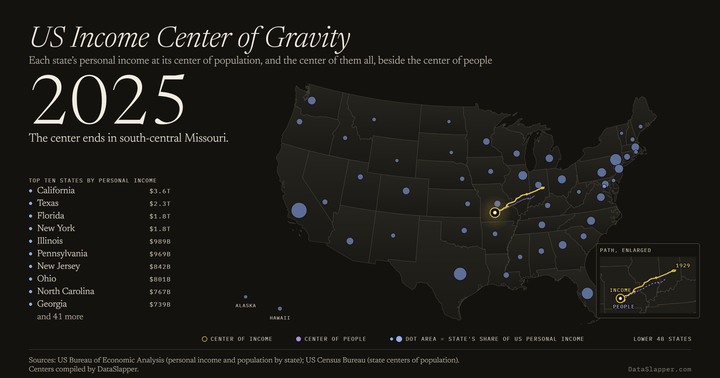
US Income Center of Gravity, 1929–2025
Where Americans' personal income centers each year, each state's income placed at its center of population, drifting from central Indiana to south-central Missouri and closing on the center of people, 1929 to 2025.
Updated 2025 -
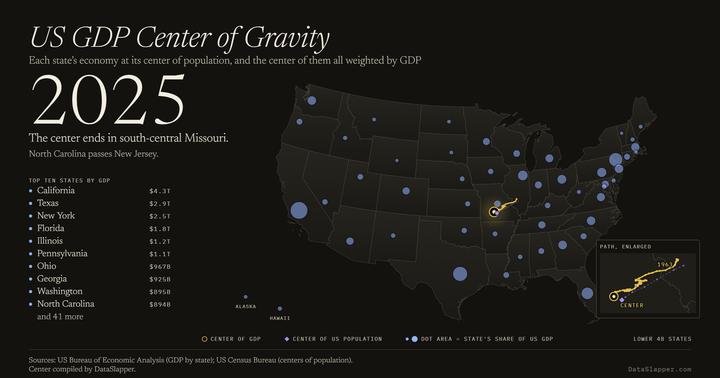
US GDP Center of Gravity, 1963–2025
Where America's economic output centers each year, each state's GDP placed at its center of population, drifting from south-central Illinois to south-central Missouri, 1963 to 2025.
Updated 2025 -
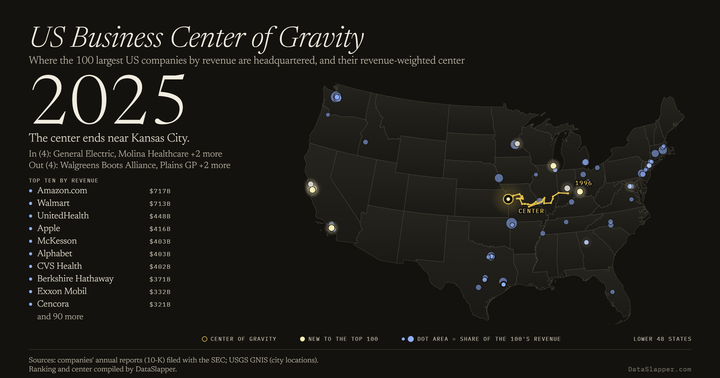
US Business Center of Gravity, 1996–2025
Where America's 100 largest companies by revenue are headquartered each year, and their revenue-weighted center drifting west to near Kansas City, 1996 to 2025.
Updated 2025 -
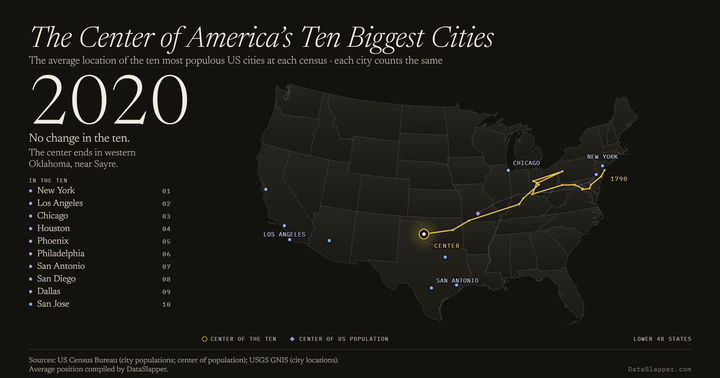
The Center of America's Ten Biggest Cities, 1790–2020
The average location of America's ten most populous cities at each census, from off the New Jersey shore in 1790 to western Oklahoma in 2020.
Updated 2020 -
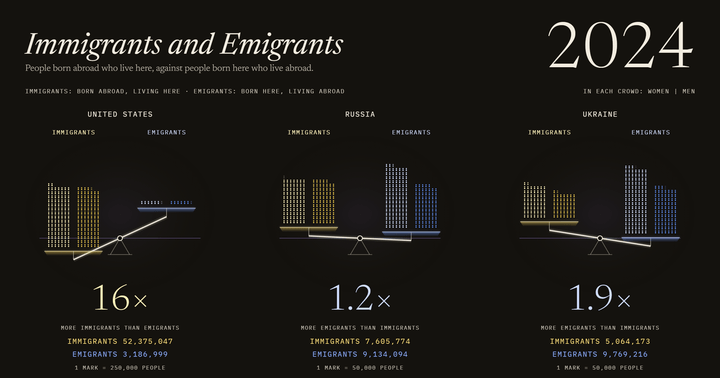
Immigrants and Emigrants: US, Russia and Ukraine, 1990–2024
People born abroad living in the US, Russia and Ukraine against people born there living abroad, drawn as crowds on a balance, 1990 to 2024.
Updated 2024 -
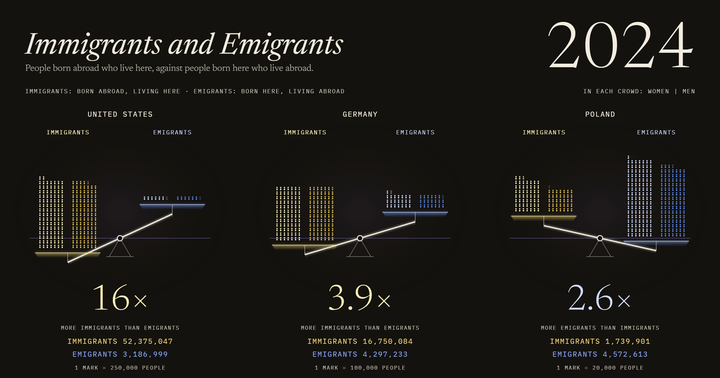
Immigrants and Emigrants: US, Germany and Poland, 1990–2024
People born abroad living in the US, Germany and Poland against people born there living abroad, drawn as crowds on a balance, 1990 to 2024.
Updated 2024 -
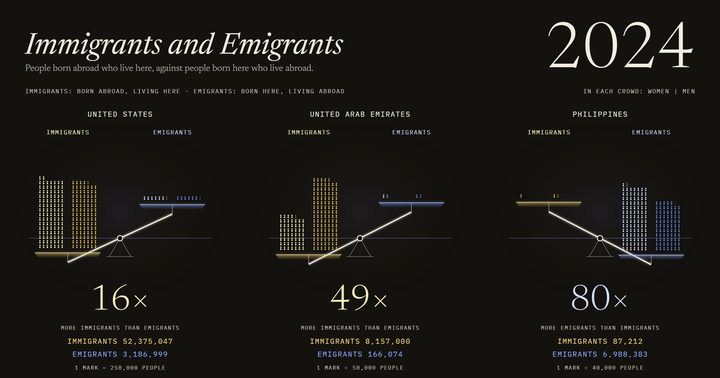
Immigrants and Emigrants: US, UAE and the Philippines, 1990–2024
People born abroad living in the US, the UAE and the Philippines against people born there living abroad, drawn as crowds on a balance, 1990 to 2024.
Updated 2024 -
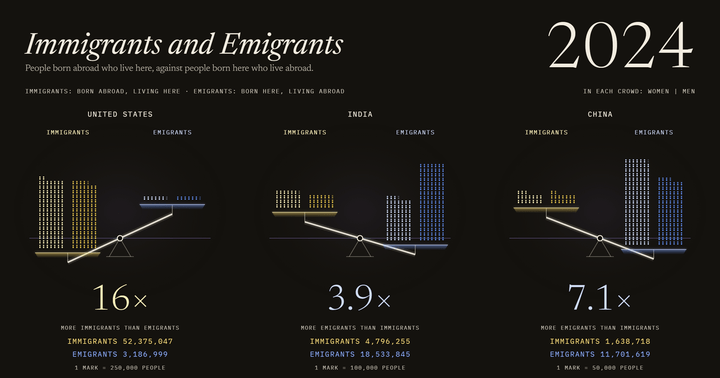
Immigrants and Emigrants: US, India and China, 1990–2024
People born abroad living in the US, India and China against people born there living abroad, drawn as crowds on a balance, 1990 to 2024.
Updated 2024 -
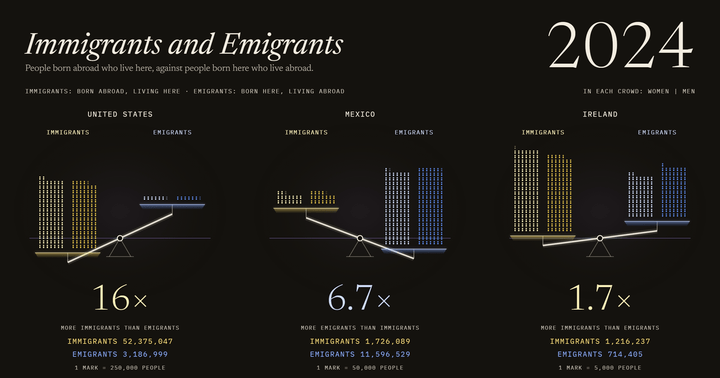
Immigrants and Emigrants: US, Mexico and Ireland, 1990–2024
People born abroad living in the US, Mexico and Ireland against people born there living abroad, drawn as crowds on a balance, 1990 to 2024.
Updated 2024 -
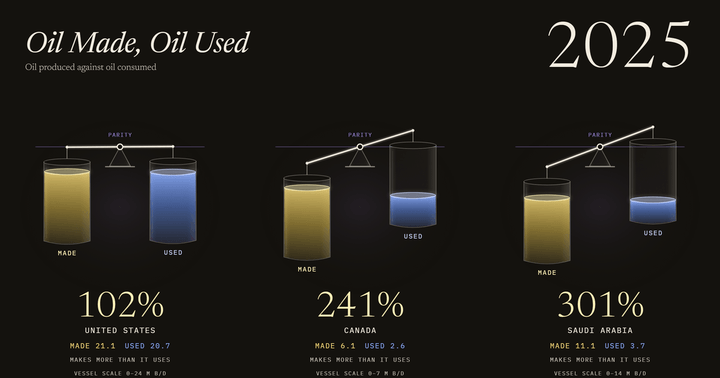
Oil Made, Oil Used: US, Canada and Saudi Arabia, 1984–2025
The oil the US, Canada and Saudi Arabia produce against the oil they consume, drawn as three balances that tip toward the heavier side, year by year since 1984.
Updated 2025 -
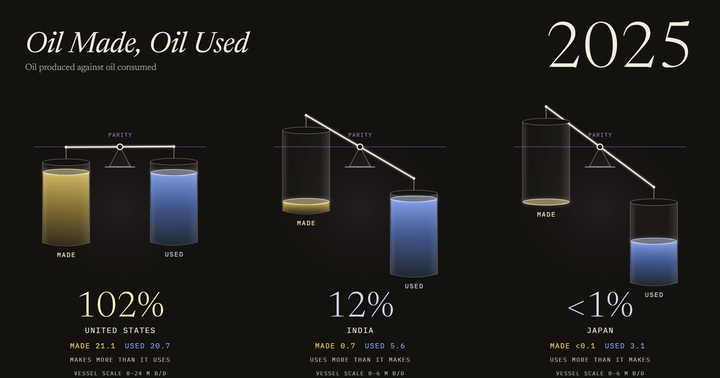
Oil Made, Oil Used: US, India and Japan, 1984–2025
The oil the US, India and Japan produce against the oil they consume, drawn as three balances that tip toward the heavier side, year by year since 1984.
Updated 2025 -
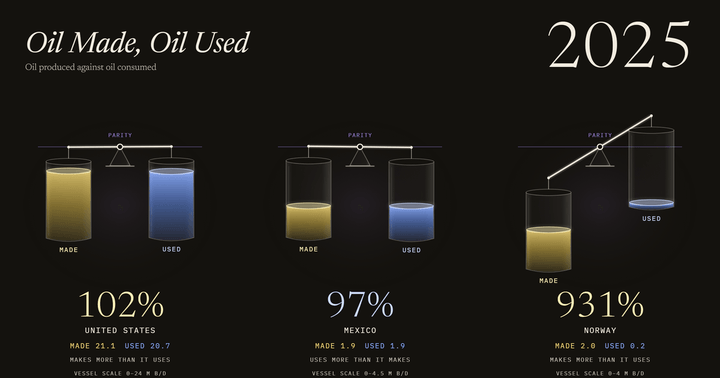
Oil Made, Oil Used: US, Mexico and Norway, 1984–2025
The oil the US, Mexico and Norway produce against the oil they consume, drawn as three balances that tip toward the heavier side, year by year since 1984.
Updated 2025 -
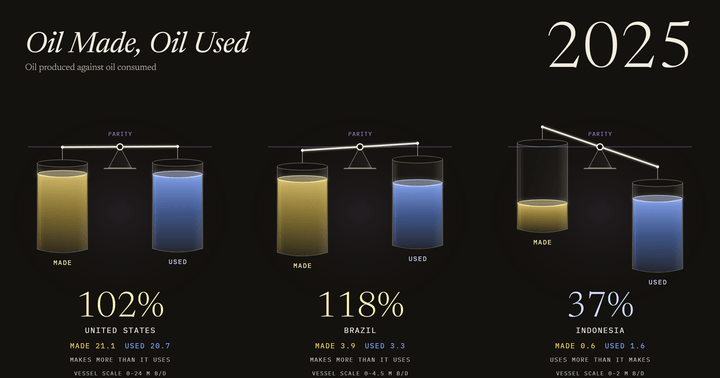
Oil Made, Oil Used: US, Brazil and Indonesia, 1984–2025
The oil the US, Brazil and Indonesia produce against the oil they consume, drawn as three balances that tip toward the heavier side, year by year since 1984.
Updated 2025 -
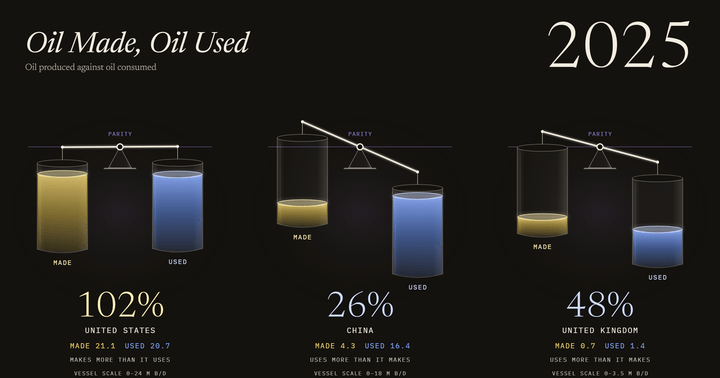
Oil Made, Oil Used: US, China and the UK, 1980–2025
The oil the US, China and the UK produce against the oil they consume, drawn as three balances that tip toward the heavier side, year by year since 1980.
Updated 2025 -
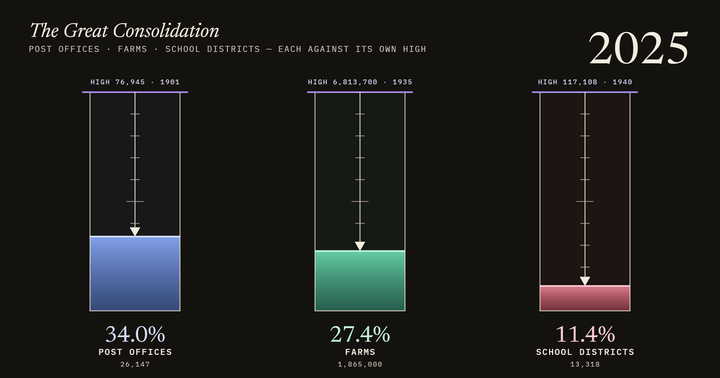
The Great Consolidation: Post Offices, Farms and School Districts, 1900–2025
US post offices, farms and public school districts as three shafts, each measured down from its own record high, year by year since 1900.
Updated 2025 -
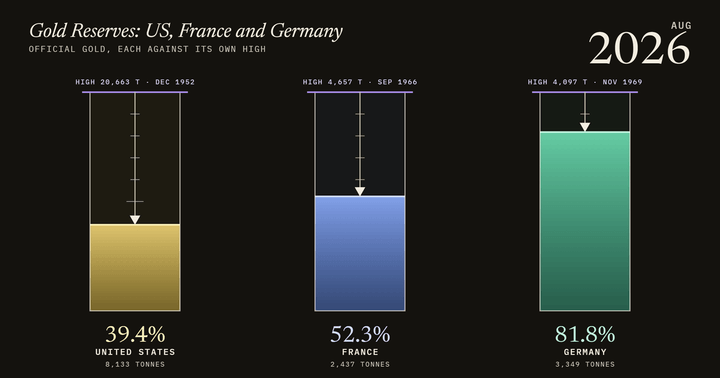
Gold Reserves: US, France and Germany, 1950–2026
The official gold of the US, France and Germany as three shafts, each measured down from its own record high, month by month since 1950.
Updated August 2026 -
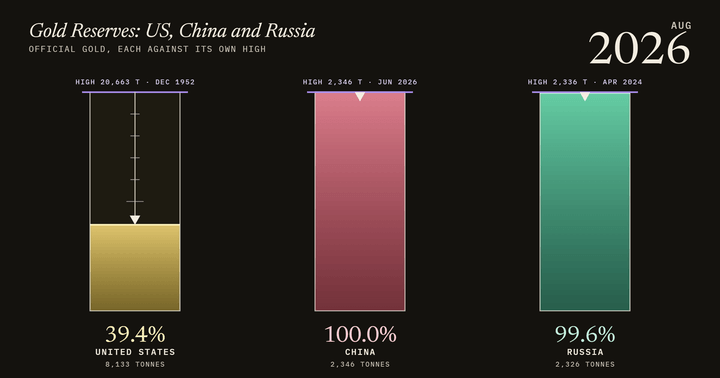
Gold Reserves: US, China and Russia, 1950–2026
The official gold of the US, China and Russia as three shafts, each measured down from its own record high, month by month since 1950.
Updated August 2026 -
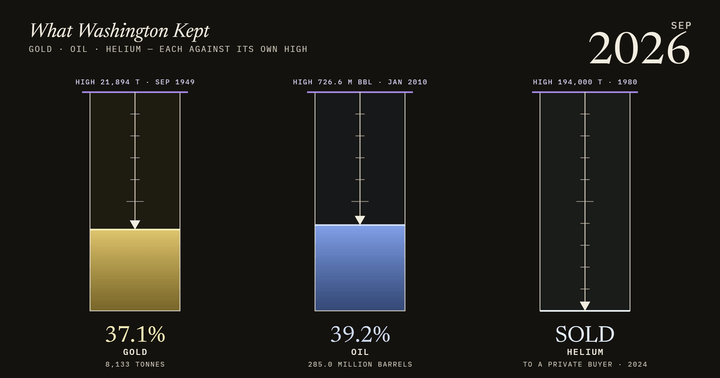
What Washington Kept: Gold, Oil and Helium, 1947–2026
US gold, the Strategic Petroleum Reserve and federal helium as three shafts, each measured down from its own record high, from 1947 to the helium sale of 2024 and today.
Updated 16 September 2026 -
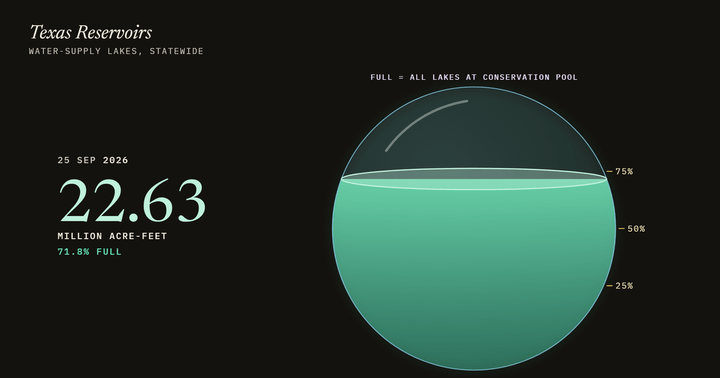
Texas Reservoirs, 1950–2026
Texas's water-supply reservoirs as a glass sphere, month by month from the drought of the 1950s to today.
Updated 25 September 2026 -
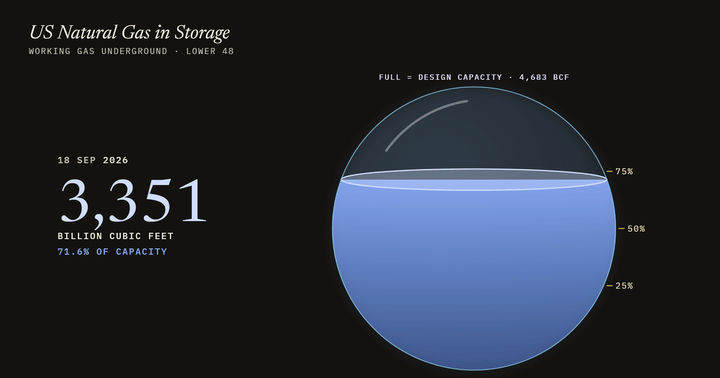
US Natural Gas in Storage, 2010–2026
The natural gas stored underground in the Lower 48 states as a glass sphere, filling every summer and drawn down every winter, week by week since 2010.
Updated 18 September 2026 -
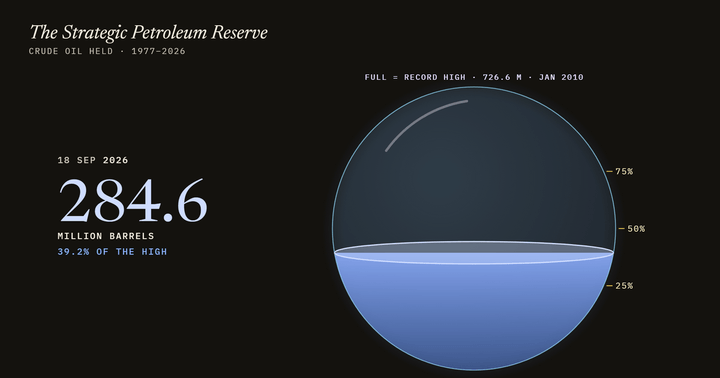
The Strategic Petroleum Reserve, 1977–2026
The US Strategic Petroleum Reserve as a glass sphere, filling from its first barrels in 1977 to its 2010 high and draining since, week by week.
Updated 18 September 2026 -
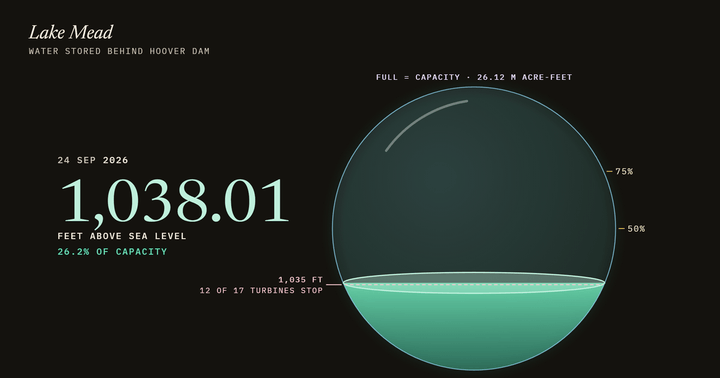
Lake Mead's Water Level, 1935–2026
Lake Mead as a glass sphere filling and draining month by month since 1935, with a dashed line at 1,035 feet, below which most of Hoover Dam's turbines cannot run.
Updated 24 September 2026 -
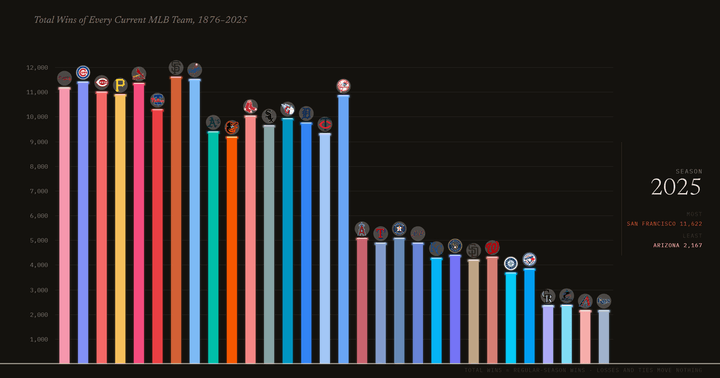
Total Wins of Every Current MLB Team, 1876–2025
Every current MLB club as one bar, growing by its wins season by season from 1876, with the club's mark riding the tip. The Cubs lead for seventy-nine seasons in all; San Francisco takes it in 1966 and holds it for sixty.
Updated the 2025 season -
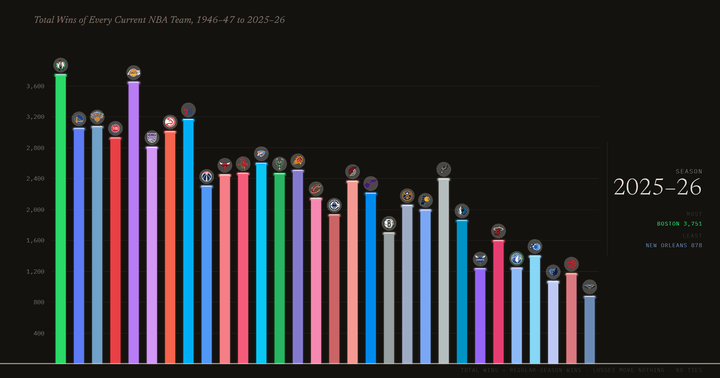
Total Wins of Every Current NBA Team, 1946–47 to 2025–26
Every current NBA club as one bar, growing by its wins season by season from 1946–47, with the club's mark riding the tip. New York leads for eleven seasons and Boston for fifty-two.
Updated the 2025–26 season -
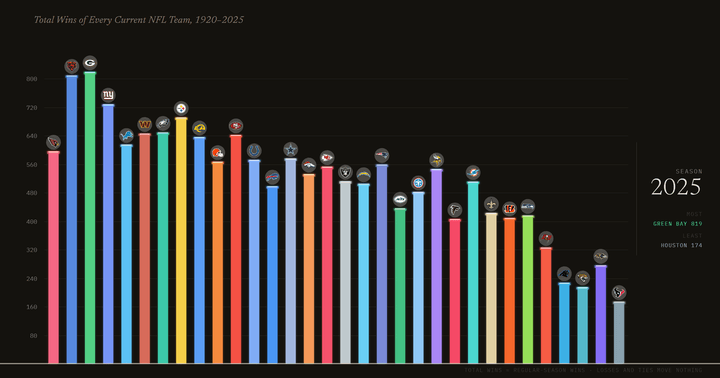
Total Wins of Every Current NFL Team, 1920–2025
Every current NFL club as one bar, growing by its wins season by season from 1920, with the club's mark riding the tip. Chicago leads for 102 seasons; Green Bay takes it in 2022.
Updated the 2025 season -
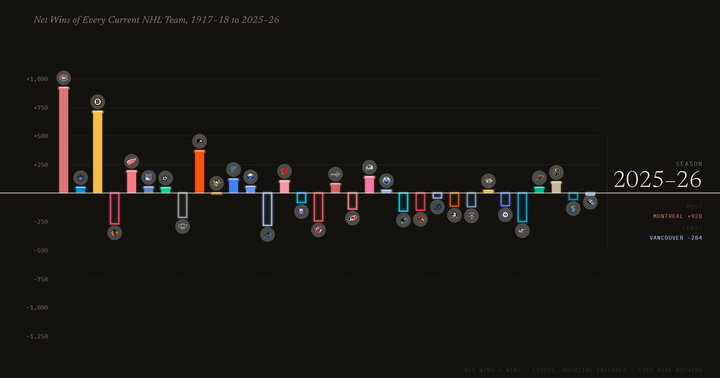
Net Wins of Every Current NHL Team, 1917–18 to 2025–26
Every current NHL club as one bar, ticking up or down by its net wins season by season from 1917–18, with the club's mark riding the tip. Montreal has been the highest bar for sixty-nine straight seasons.
Updated the 2025–26 season -
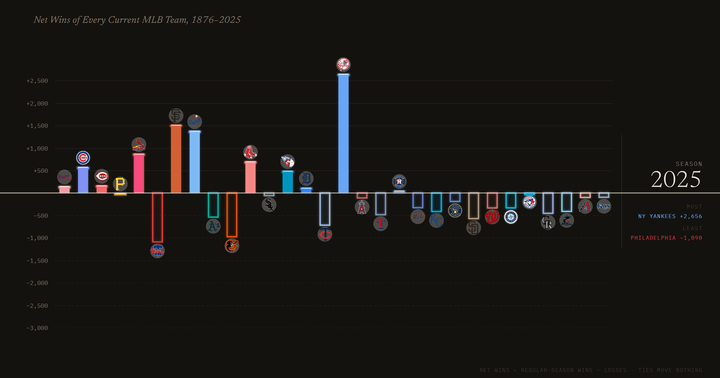
Net Wins of Every Current MLB Team, 1876–2025
Every current MLB club as one bar, ticking up or down by its net wins season by season from 1876, with the club's mark riding the tip. The Yankees lead for seventy-two straight seasons; Pittsburgh ends exactly level.
Updated the 2025 season -
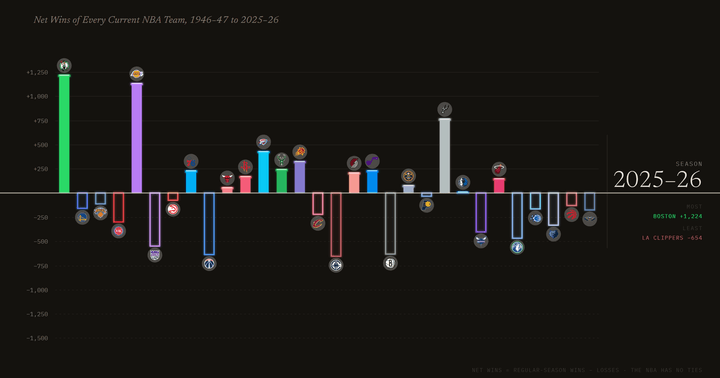
Net Wins of Every Current NBA Team, 1946–47 to 2025–26
Every current NBA club as one bar, ticking up or down by its net wins season by season from 1946–47, with the club's mark riding the tip. Boston is the lowest bar for five seasons, then the highest for thirty-eight.
Updated the 2025–26 season -
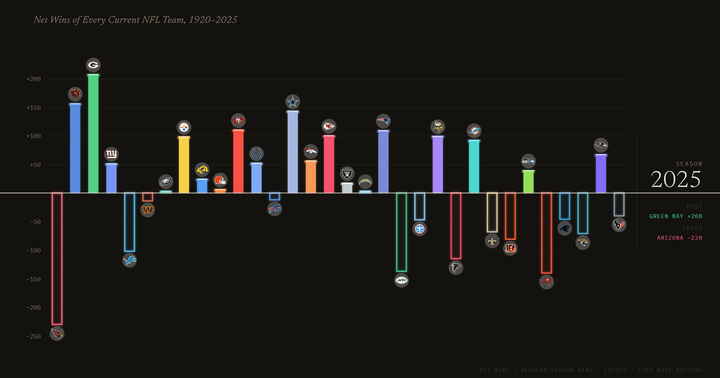
Net Wins of Every Current NFL Team, 1920–2025
Every current NFL club as one bar, ticking up or down by its net wins season by season from 1920, with the club's mark riding the tip. Chicago leads for 96 seasons; Green Bay takes it in 2019.
Updated the 2025 season -
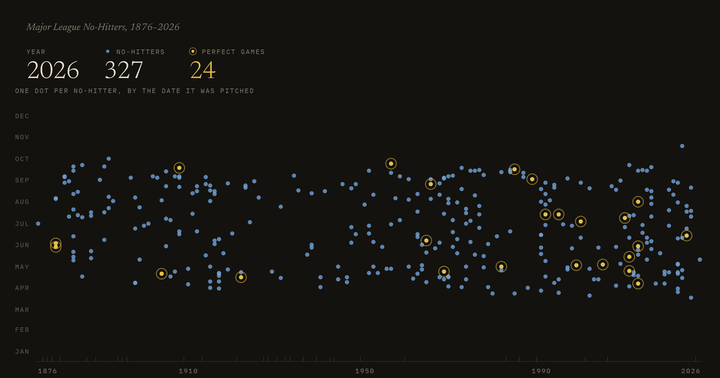
Major League No-Hitters, 1876–2026
Every no-hitter in Major League Baseball as one dot, by year and date of the game, with the perfect games ringed. 1876 to 2026.
Updated the 2026 season -
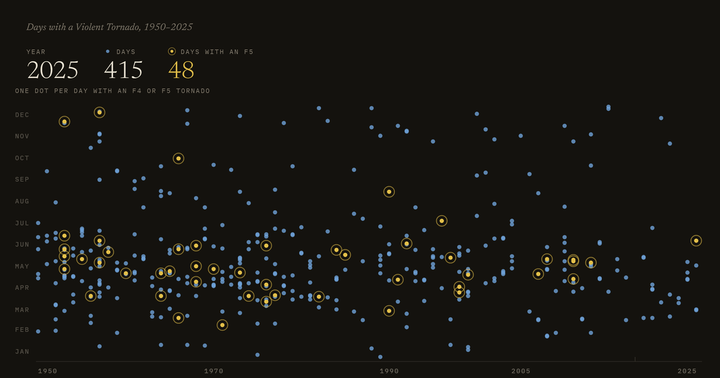
Days with a Violent Tornado, 1950–2025
Every day a violent tornado struck the United States as one dot, by year and date, with the days that had an F5 ringed. 1950 to 2025.
Updated 2025 -
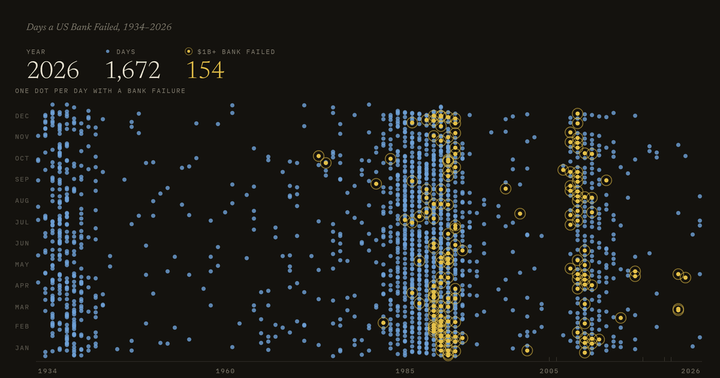
Days a US Bank Failed, 1934–2026
Every day an FDIC-insured bank failed as one dot, by year and date, with the days a billion-dollar bank went down ringed. 1934 to 2026.
Updated 21 August 2026 -
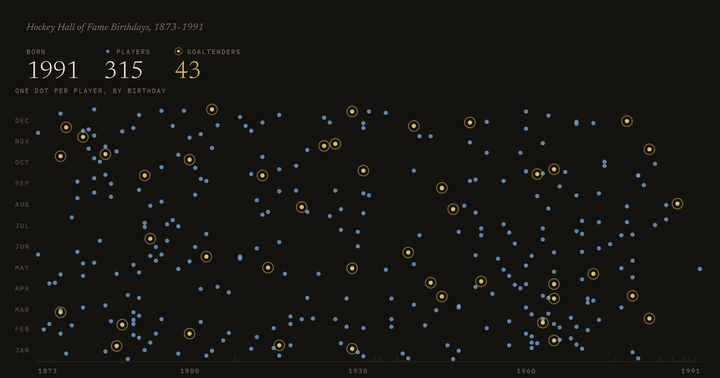
Hockey Hall of Fame Birthdays, 1873–1991
Every player in the Hockey Hall of Fame as one dot, by year and date of birth, with the goaltenders ringed. Born 1873 to 1991.
Updated the 2026 induction class -
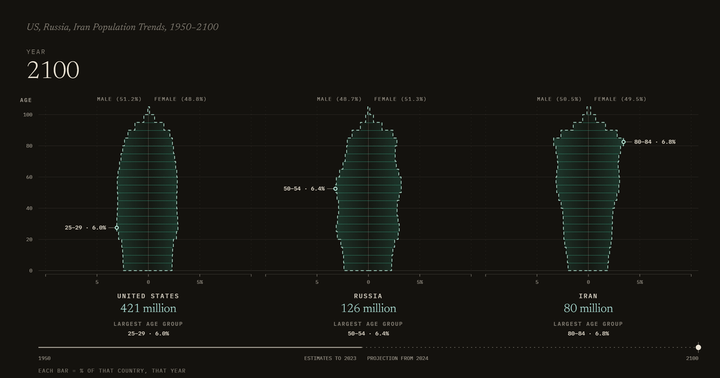
US, Russia, Iran Population Trends, 1950–2100
The population pyramids of the United States, Russia and Iran side by side — each age group's share by sex, year by year from 1950, with the UN's projection to 2100.
Updated 2100 (estimates to 2023) -
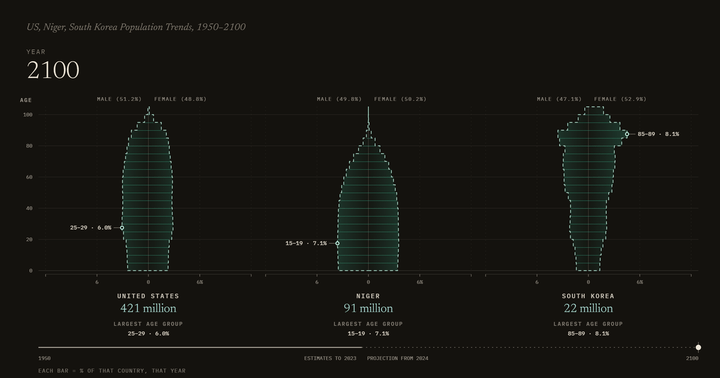
US, Niger, South Korea Population Trends, 1950–2100
The population pyramids of the United States, Niger and South Korea side by side — each age group's share by sex, year by year from 1950, with the UN's projection to 2100.
Updated 2100 (estimates to 2023) -
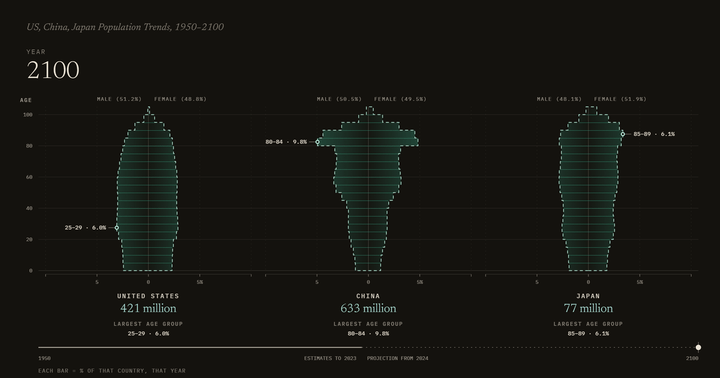
US, China, Japan Population Trends, 1950–2100
The population pyramids of the United States, China and Japan side by side — each age group's share by sex, year by year from 1950, with the UN's projection to 2100.
Updated 2100 (estimates to 2023) -
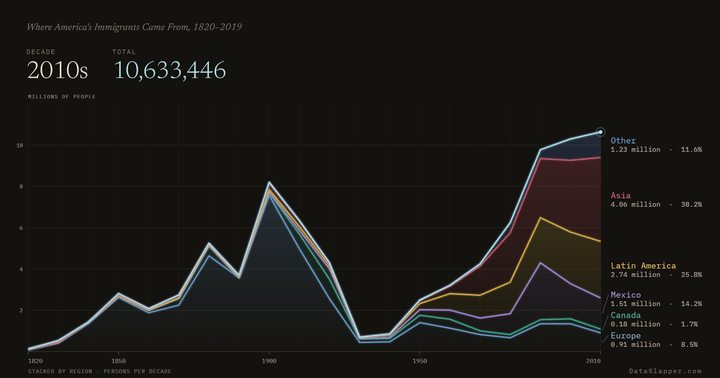
Where America's Immigrants Came From, 1820–2019
Where America's immigrants came from as a rising tide — Europe, Canada, Mexico, Latin America, Asia and the rest, stacked by decade since the 1820s.
Updated the 2010s -
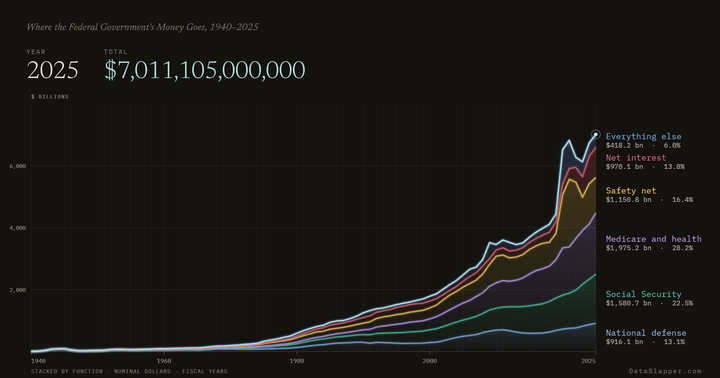
Where the Federal Government's Money Goes, 1940–2025
Federal outlays by function as a rising tide — defense, Social Security, health, the safety net, interest and the rest, stacked in nominal dollars. Fiscal years since 1940.
Updated FY2025 -
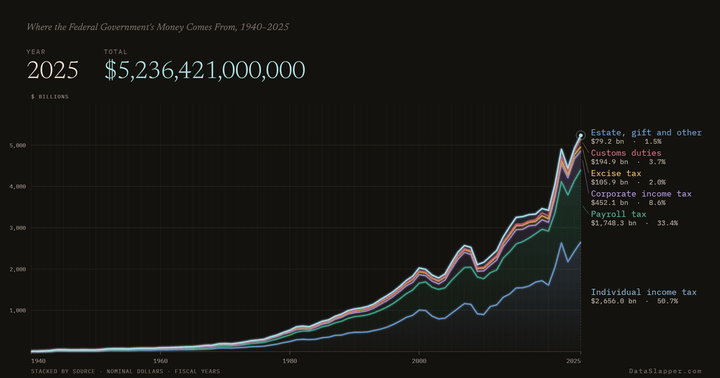
Where the Federal Government's Money Comes From, 1940–2025
Federal receipts by source as a rising tide — income, payroll, corporate, excise and customs taxes and the rest, stacked in nominal dollars. Fiscal years since 1940.
Updated FY2025 -
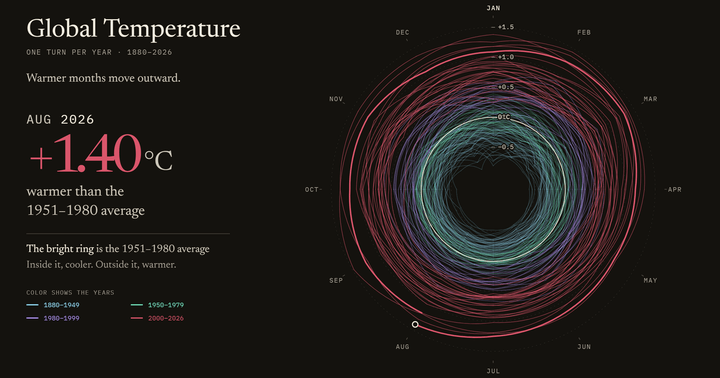
Global Temperature, One Turn per Year, 1880–2026
The global surface temperature as a spiral, one turn per year, each month's distance from the 1951–1980 average. Monthly since 1880.
Updated August 2026 -
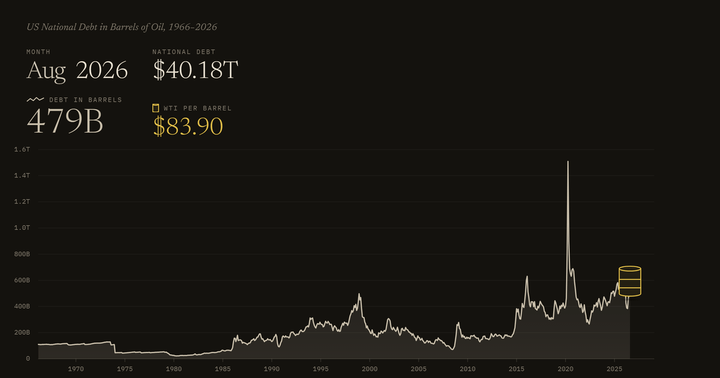
US National Debt in Barrels of Oil, 1966–2026
The national debt in barrels of oil as a line, the price of a barrel of WTI crude as a barrel. Monthly since 1966.
Updated August 2026 -
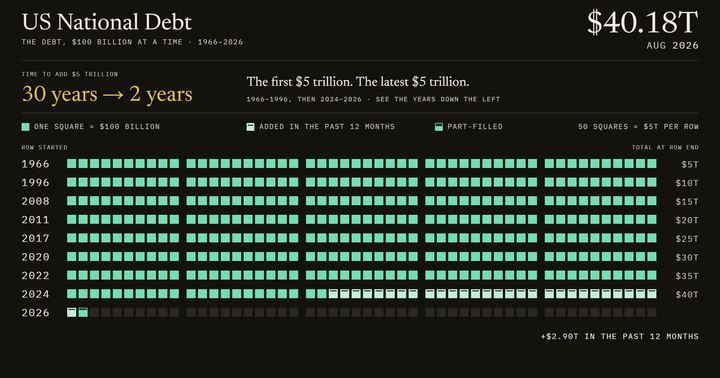
US National Debt, One Square per $100 Billion, 1966–2026
The US national debt as squares of $100 billion lighting up month by month, fifty to a row, the year each row began beside it. Monthly since 1966.
Updated August 2026 -
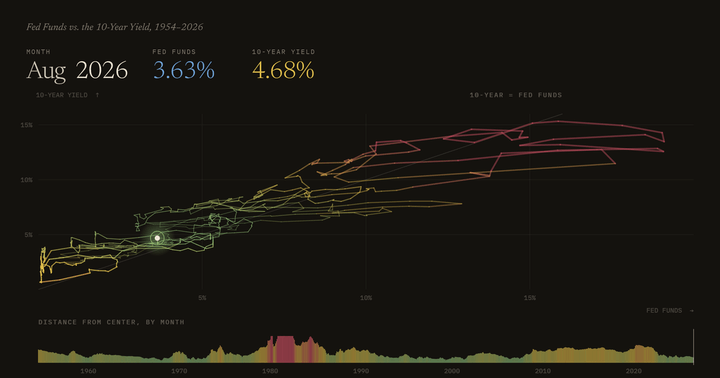
Fed Funds vs. the 10-Year Yield, 1954–2026
The federal funds rate against the 10-year Treasury yield, one point per month joined into a path, with a timeline below. Monthly since 1954.
Updated August 2026 -
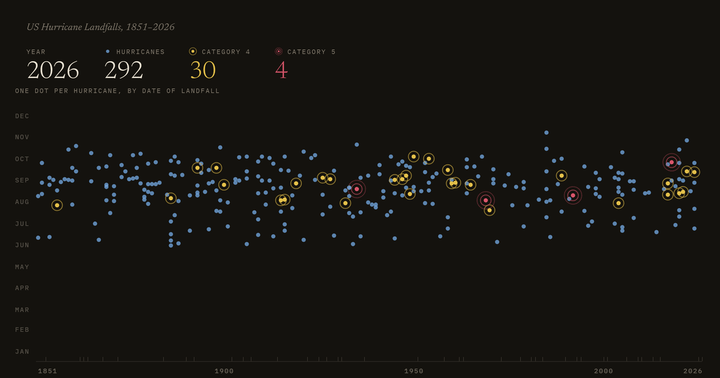
US Hurricane Landfalls, 1851–2026
Every hurricane to make landfall on the continental US as one dot, by year and date, with Category 4 and 5 storms ringed. Since 1851.
Updated 2026 season to date -
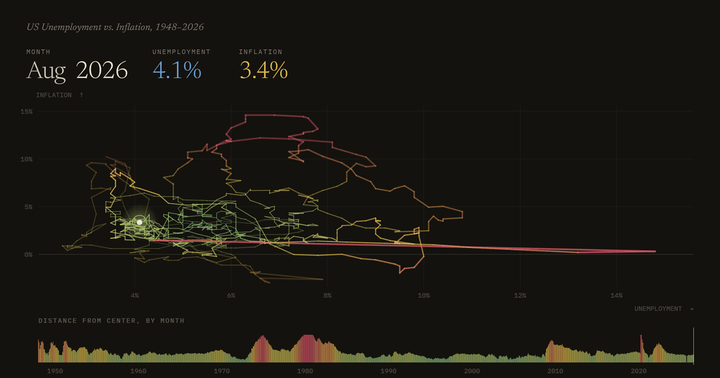
US Unemployment vs. Inflation, 1948–2026
The unemployment rate against inflation, one point per month joined into a path, with a timeline below. Monthly since 1948.
Updated August 2026 -
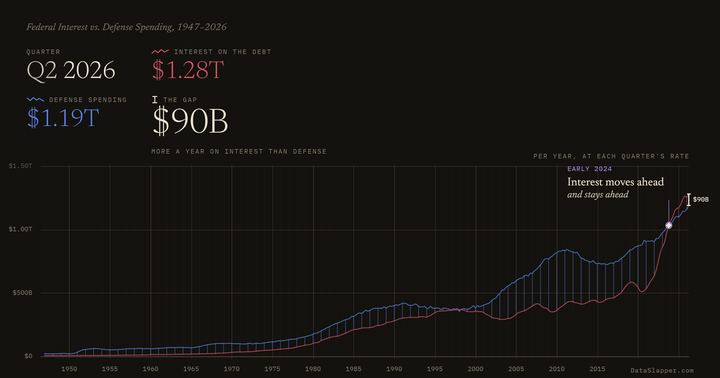
Federal Interest vs. Defense Spending, 1947–2026
Federal interest payments and defense spending as two lines, with a rung between them every year and the gap at the tip. Quarterly since 1947.
Updated Q2 2026 -
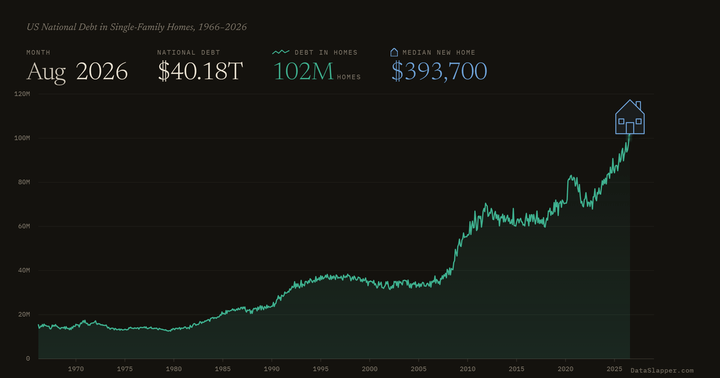
US National Debt in Single-Family Homes, 1966–2026
The national debt in new single-family homes as a line, the median home price as a house. Monthly since 1966.
Updated August 2026 -
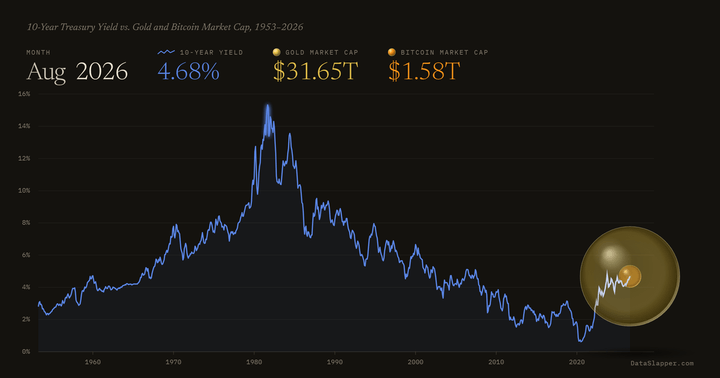
10-Year Treasury Yield vs. Gold and Bitcoin Market Cap, 1953–2026
The 10-year Treasury yield as a line, gold's market cap as a sphere with bitcoin's inside it. Monthly since 1953.
Updated August 2026 -
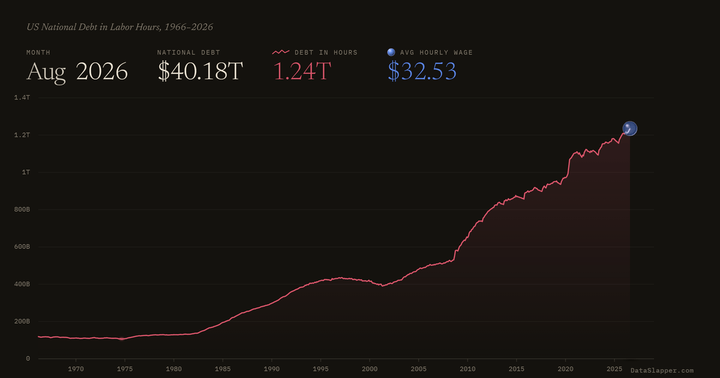
US National Debt in Labor Hours, 1966–2026
The national debt in hours of work as a line, the average hourly wage as a sphere. Monthly since 1966.
Updated August 2026 -
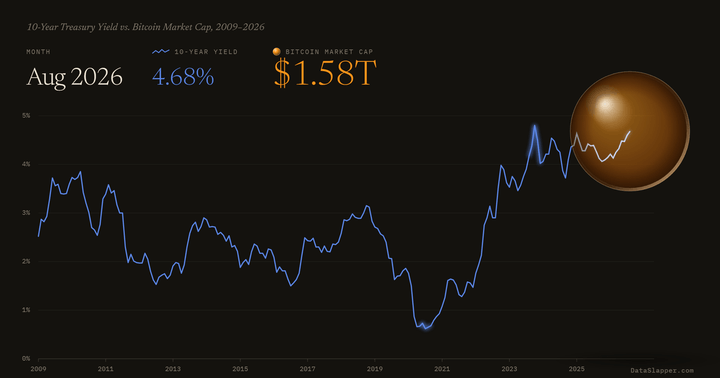
10-Year Treasury Yield vs. Bitcoin Market Cap, 2009–2026
The 10-year Treasury yield as a line, bitcoin's market cap as a sphere. Monthly since 2009.
Updated August 2026 -
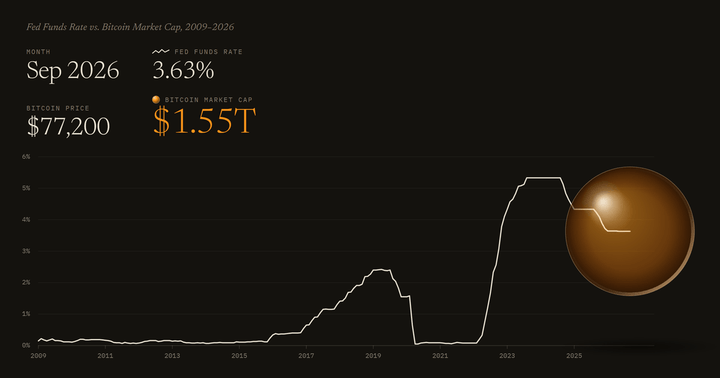
Fed Funds Rate vs. Bitcoin Market Cap, 2009–2026
The fed funds rate as a line, bitcoin's market cap as a sphere. Monthly since 2009.
Updated September 2026 -
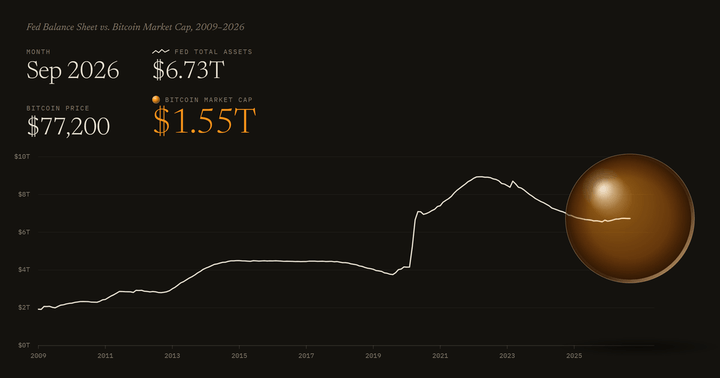
Fed Balance Sheet vs. Bitcoin Market Cap, 2009–2026
The Fed's total assets as a line, bitcoin's market cap as a sphere. Monthly since 2009.
Updated September 2026 -
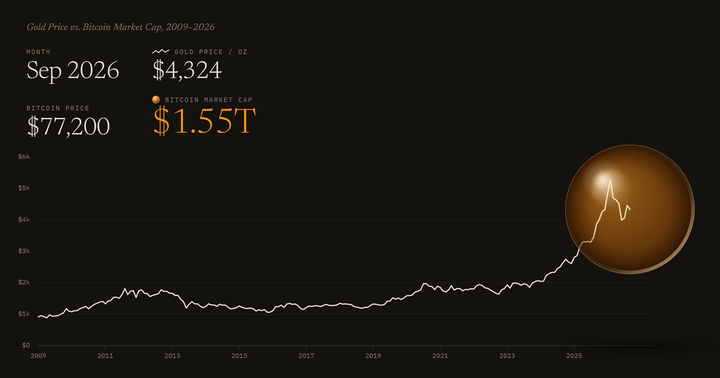
Gold Price vs. Bitcoin Market Cap, 2009–2026
The gold price as a line, bitcoin's market cap as a sphere. Monthly since 2009.
Updated September 2026