Data that hits different.
The visualizations
-
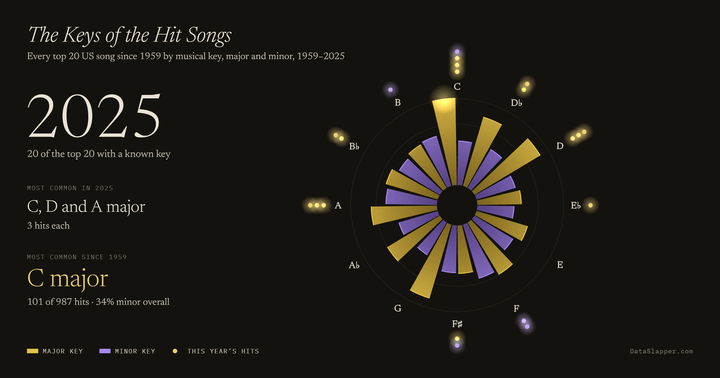
The Keys of the Hit Songs, 1959–2025
Every top 20 hit since 1959 on a wheel of the twelve keys, major and minor, building year by year; C major leads.
Updated 2025 -
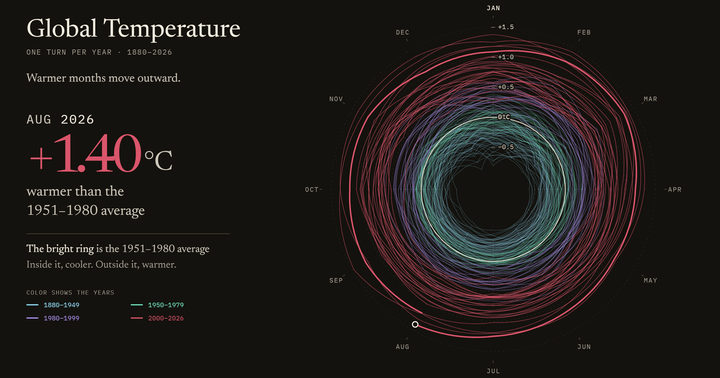
Global Temperature, One Turn per Year, 1880–2026
The global surface temperature as a spiral, one turn per year, each month's distance from the 1951–1980 average. Monthly since 1880.
Updated August 2026 -
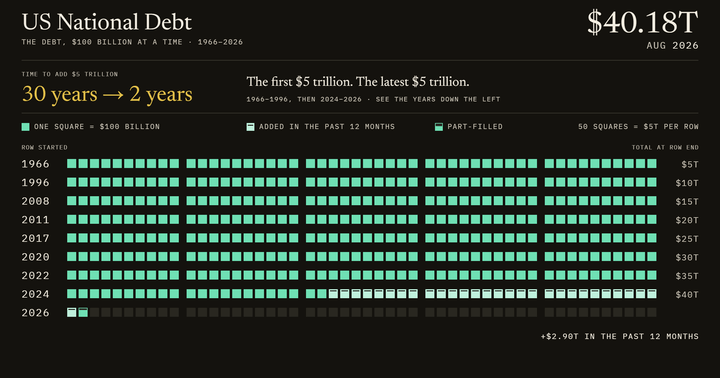
US National Debt, One Square per $100 Billion, 1966–2026
The US national debt as squares of $100 billion lighting up month by month, fifty to a row, the year each row began beside it. Monthly since 1966.
Updated August 2026 -
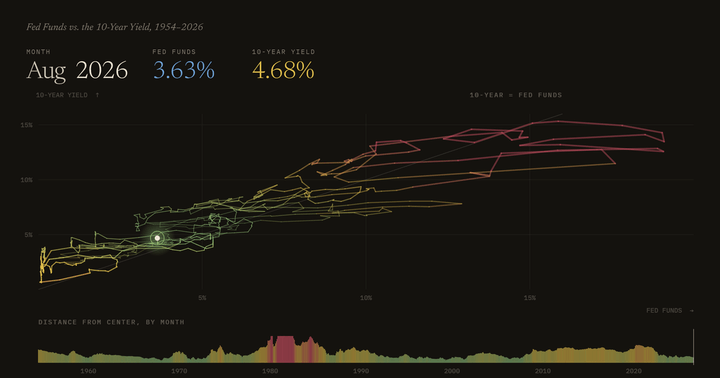
Fed Funds vs. the 10-Year Yield, 1954–2026
The federal funds rate against the 10-year Treasury yield, one point per month joined into a path, with a timeline below. Monthly since 1954.
Updated August 2026 -
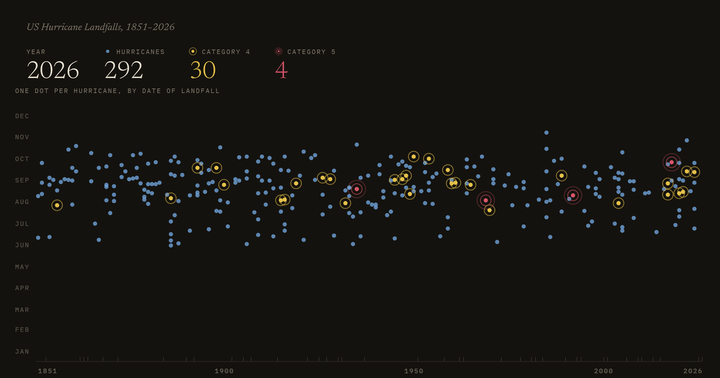
US Hurricane Landfalls, 1851–2026
Every hurricane to make landfall on the continental US as one dot, by year and date, with Category 4 and 5 storms ringed. Since 1851.
Updated 2026 season to date -
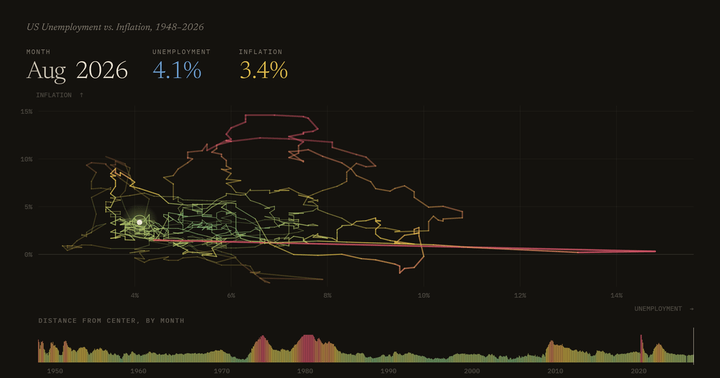
US Unemployment vs. Inflation, 1948–2026
The unemployment rate against inflation, one point per month joined into a path, with a timeline below. Monthly since 1948.
Updated August 2026 -
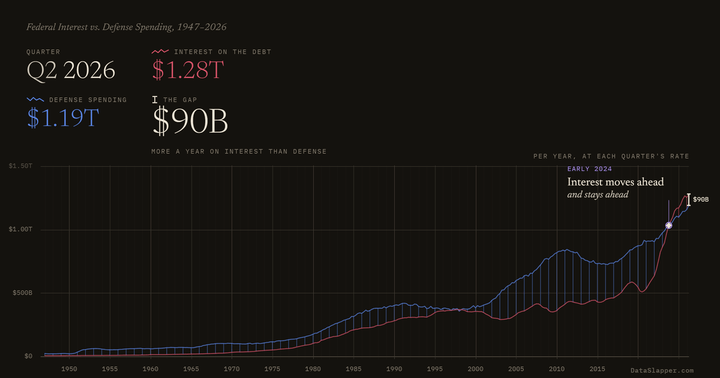
Federal Interest vs. Defense Spending, 1947–2026
Federal interest payments and defense spending as two lines, with a rung between them every year and the gap at the tip. Quarterly since 1947.
Updated Q2 2026 -
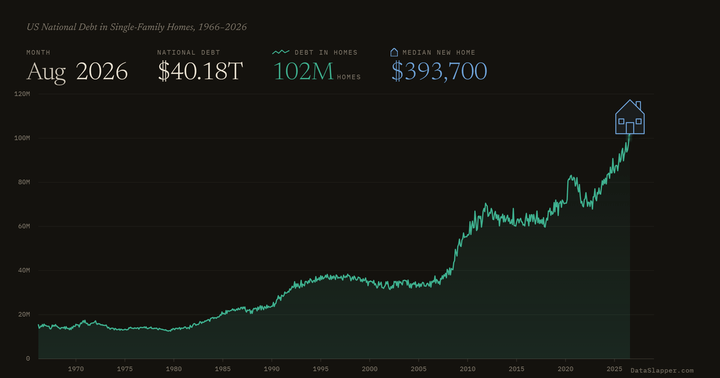
US National Debt in Single-Family Homes, 1966–2026
The national debt in new single-family homes as a line, the median home price as a house. Monthly since 1966.
Updated August 2026 -
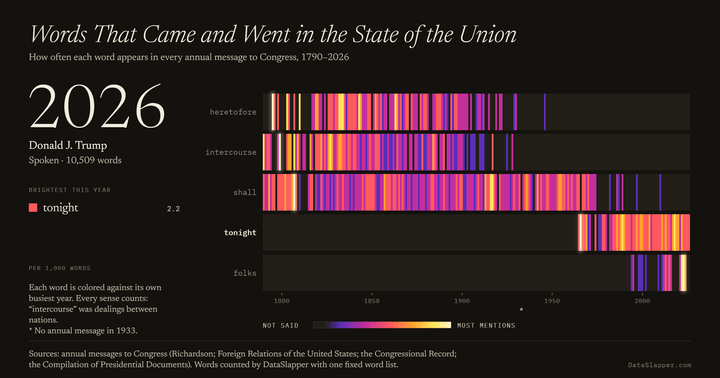
Words That Came and Went in the State of the Union, 1790–2026
How often five words, from heretofore and intercourse to tonight and folks, appear in every State of the Union message since 1790, as a grid that lights each word against its own busiest year.
Updated 2026 -
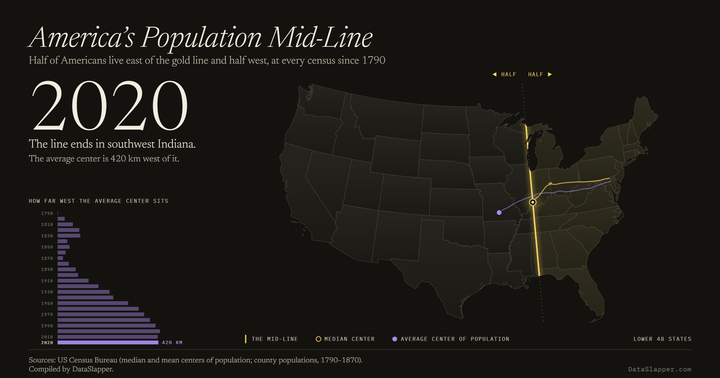
America's Population Mid-Line, 1790–2020
The line with half of Americans on each side, at every census since 1790 — from just east of Baltimore into southwest Indiana — as the average center runs off toward Missouri.
Updated 2020
More Visualizations
- The Federal Minimum Wage in Ounces of Silver, 1939–2025
- Party Control and America's Wars, 1789–2025
- The Biggest State Economies, 1963–2025
- Real Time US Federal Tax Collection
- Real Time US Paper Money Printing
- Real Time Animals Slaughtered for US Meat
- Real Time Births and Deaths Worldwide
- Real Time Oil Usage Worldwide
- “Love” Is Fading from Song Titles, 1959–2025
- Fewer New Faces in Pop Music, 1965–2025
- Too Young, Too Old: Pop Stars’ Ages, 1959–2025
- It Takes Two: Hit Songs by More Than One Act, 1959–2025
- Hit Songs: The Rise and Fall of “Featuring”, 1959–2025
- Where Did the Bands Go? 1959–2025
- It Takes a Room to Write a Hit Song, 1959–2025
- Pop Songs Went Minor, 1959–2025
- Long Songs Out, Short Songs In, 1959–2025
- Party Control of the White House, Senate and House, 1789–2027
- The Reading Level of the State of the Union, 1790–2026
- Country Names in the State of the Union, 1790–2026