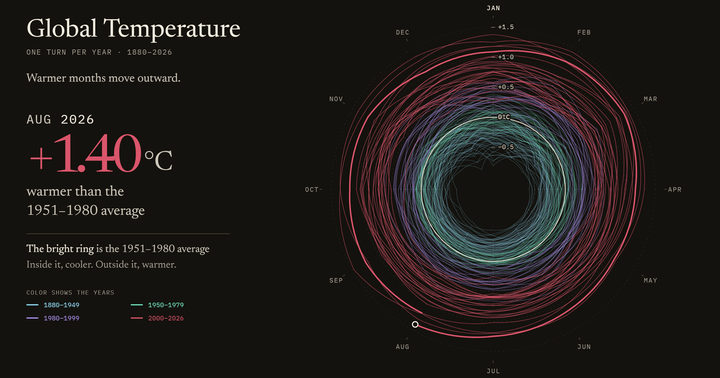
Every chart drawn in this format, newest first. How it reads: Methodology.
The global surface temperature as a spiral, one turn per year, each month's distance from the 1951–1980 average. Monthly since 1880.