Economy & Work
Growth, inflation, unemployment, wages, jobs, trade, manufacturing and what people buy.
-
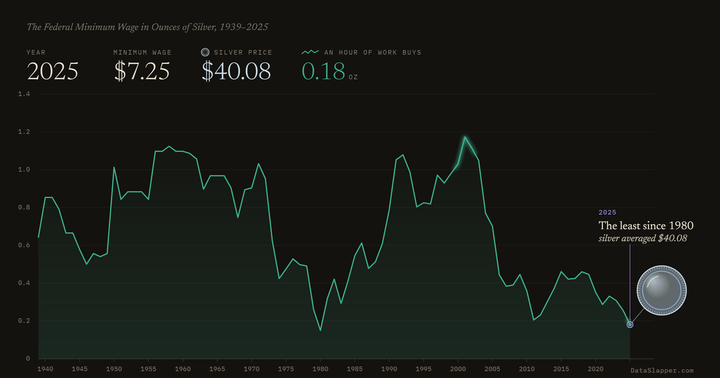
The Federal Minimum Wage in Ounces of Silver, 1939–2025
One hour at the federal minimum wage priced in silver, 1939–2025: 1.17 ounces at the 2001 high, and 0.18 in 2025, the least since 1980.
Updated 2025 -
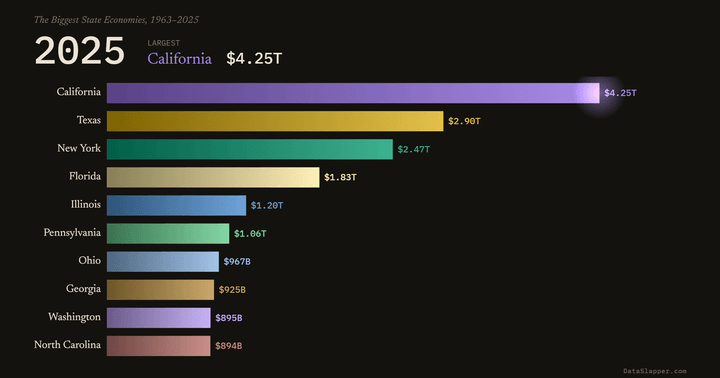
The Biggest State Economies, 1963–2025
The ten largest US state economies, year by year since 1963: California passes New York in 1971, and Texas passes New York in 2006.
Updated 2025 -
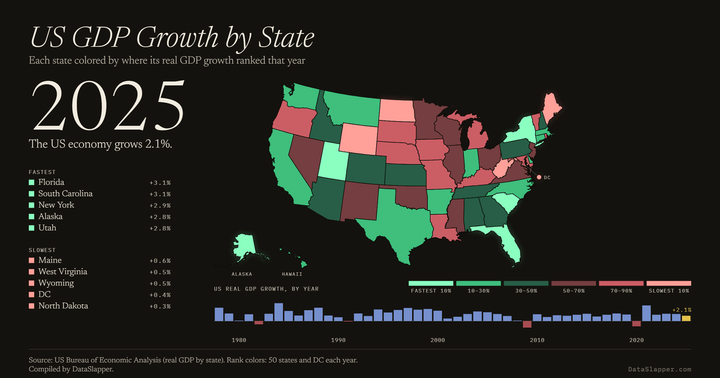
US GDP Growth by State, 1978–2025
Every state's growth in real GDP, ranked each year from 1978 to 2025 — the fastest in mint, the slowest in coral — above a bar of the nation's growth.
Updated 2025 -
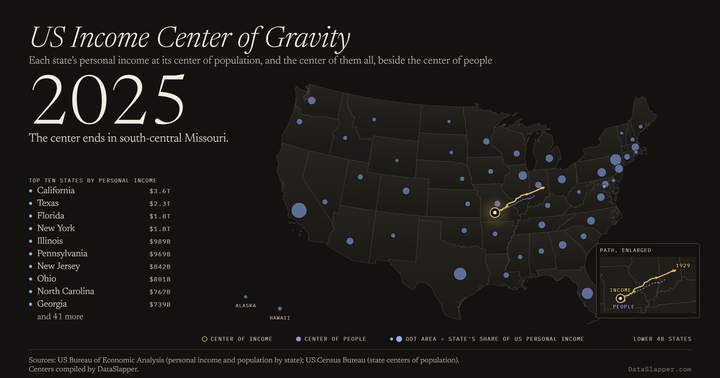
US Income Center of Gravity, 1929–2025
Where Americans' personal income centers each year, each state's income placed at its center of population, drifting from central Indiana to south-central Missouri and closing on the center of people, 1929 to 2025.
Updated 2025 -
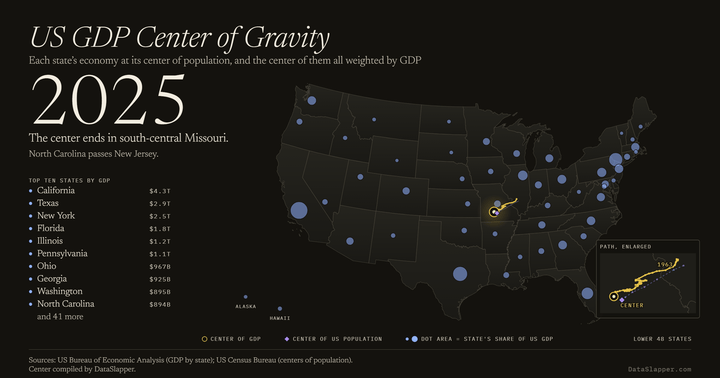
US GDP Center of Gravity, 1963–2025
Where America's economic output centers each year, each state's GDP placed at its center of population, drifting from south-central Illinois to south-central Missouri, 1963 to 2025.
Updated 2025 -
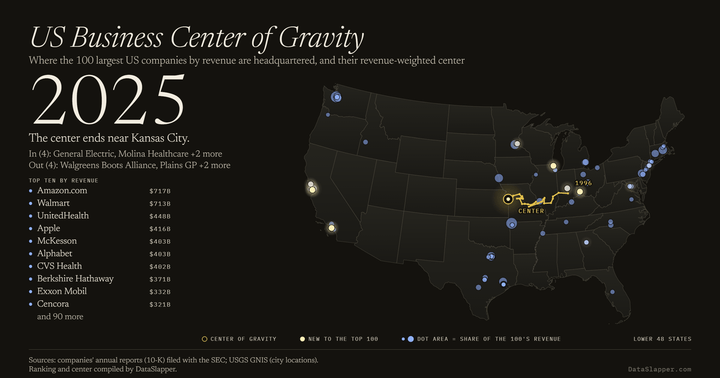
US Business Center of Gravity, 1996–2025
Where America's 100 largest companies by revenue are headquartered each year, and their revenue-weighted center drifting west to near Kansas City, 1996 to 2025.
Updated 2025 -
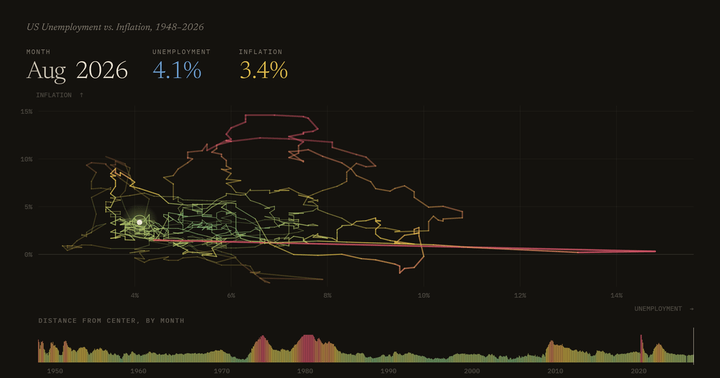
US Unemployment vs. Inflation, 1948–2026
The unemployment rate against inflation, one point per month joined into a path, with a timeline below. Monthly since 1948.
Updated August 2026