Drifting center
Every chart drawn in this format, newest first. How it reads: Methodology.
-
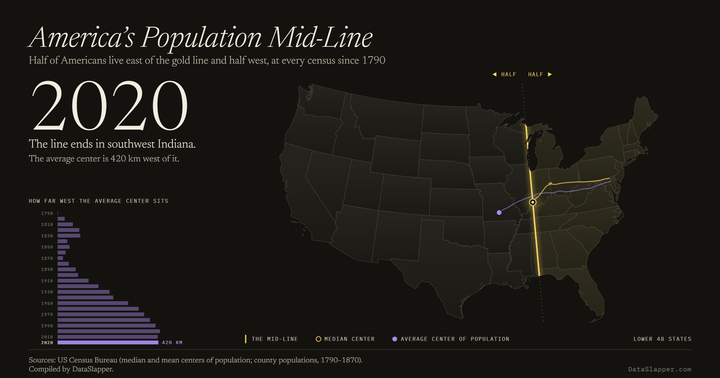
America's Population Mid-Line, 1790–2020
The line with half of Americans on each side, at every census since 1790 — from just east of Baltimore into southwest Indiana — as the average center runs off toward Missouri.
Updated 2020 -
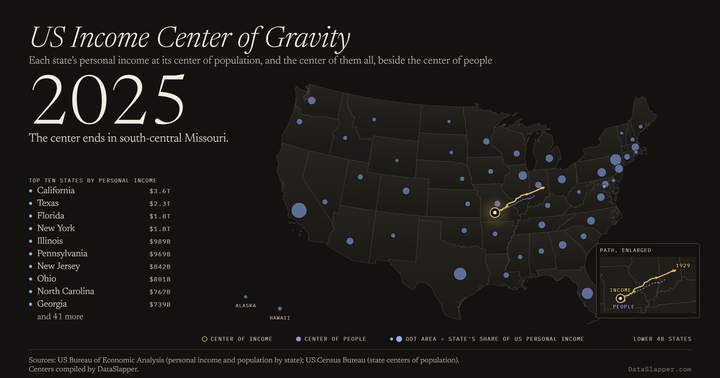
US Income Center of Gravity, 1929–2025
Where Americans' personal income centers each year, each state's income placed at its center of population, drifting from central Indiana to south-central Missouri and closing on the center of people, 1929 to 2025.
Updated 2025 -
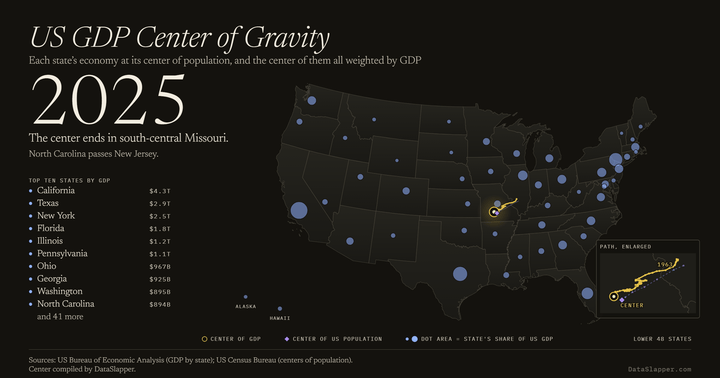
US GDP Center of Gravity, 1963–2025
Where America's economic output centers each year, each state's GDP placed at its center of population, drifting from south-central Illinois to south-central Missouri, 1963 to 2025.
Updated 2025 -
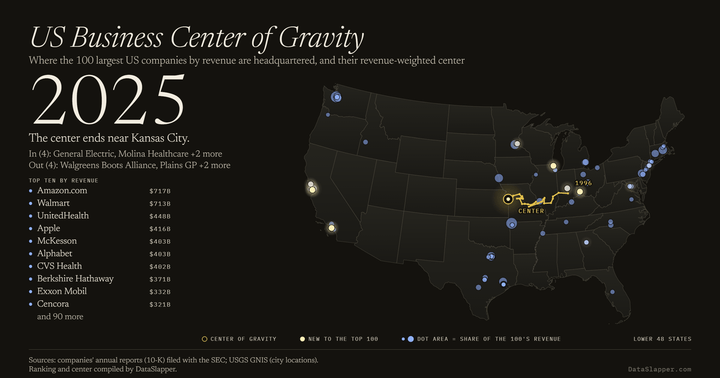
US Business Center of Gravity, 1996–2025
Where America's 100 largest companies by revenue are headquartered each year, and their revenue-weighted center drifting west to near Kansas City, 1996 to 2025.
Updated 2025 -
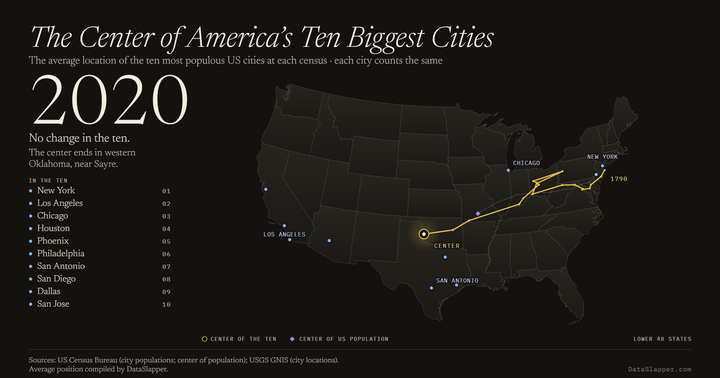
The Center of America's Ten Biggest Cities, 1790–2020
The average location of America's ten most populous cities at each census, from off the New Jersey shore in 1790 to western Oklahoma in 2020.
Updated 2020