State year-map
Every chart drawn in this format, newest first. How it reads: Methodology.
-
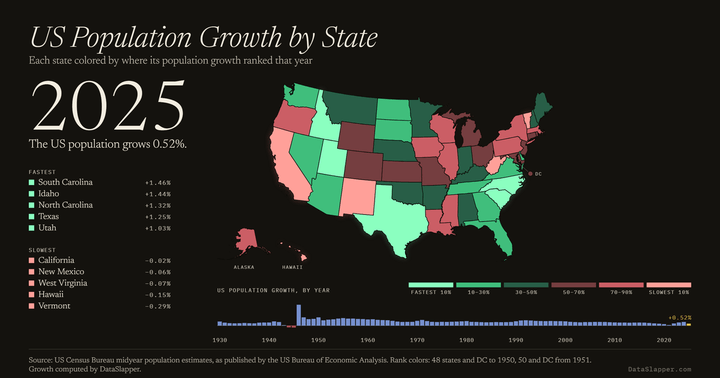
US Population Growth by State, 1930–2025
Every state's population growth, ranked each year from 1930 to 2025 — the fastest in mint, the slowest in coral — above a bar of the nation's growth.
Updated 2025 -
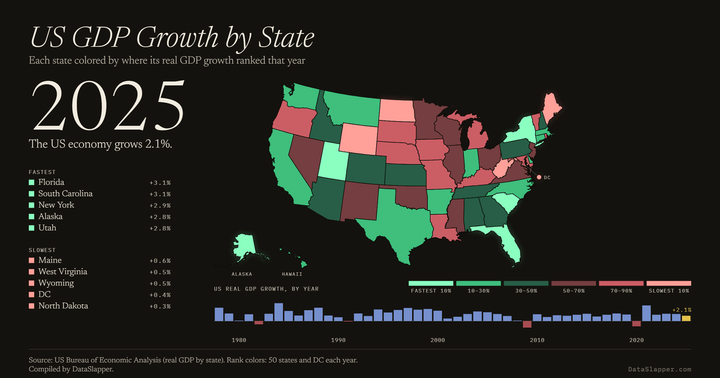
US GDP Growth by State, 1978–2025
Every state's growth in real GDP, ranked each year from 1978 to 2025 — the fastest in mint, the slowest in coral — above a bar of the nation's growth.
Updated 2025