Second Layer
Every chart that draws this series, newest first.
-
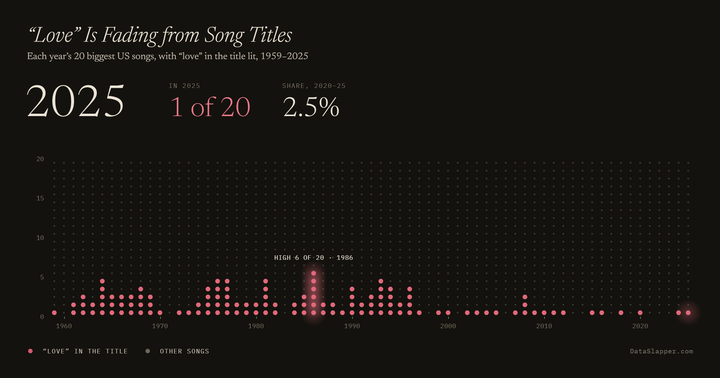
“Love” Is Fading from Song Titles, 1959–2025
How many of America's 20 biggest songs each year have "love" in the title, 1959–2025: about one in eight through the 1990s, 3 of 120 since 2020.
Updated 2025 -
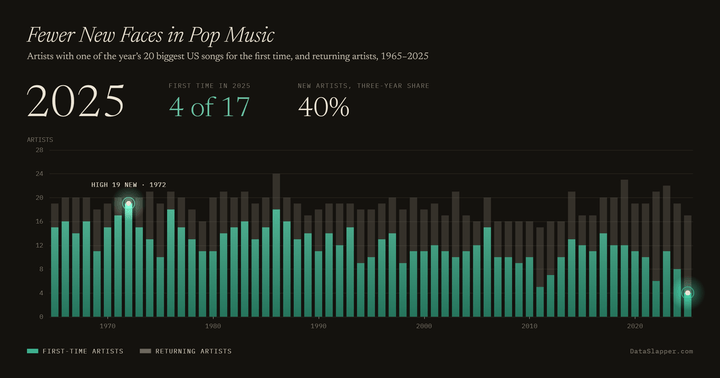
Fewer New Faces in Pop Music, 1965–2025
How many of the artists behind America's 20 biggest songs each year were there for the first time, 1965–2025: 19 of 20 in 1972, 4 of 17 in 2025.
Updated 2025 -
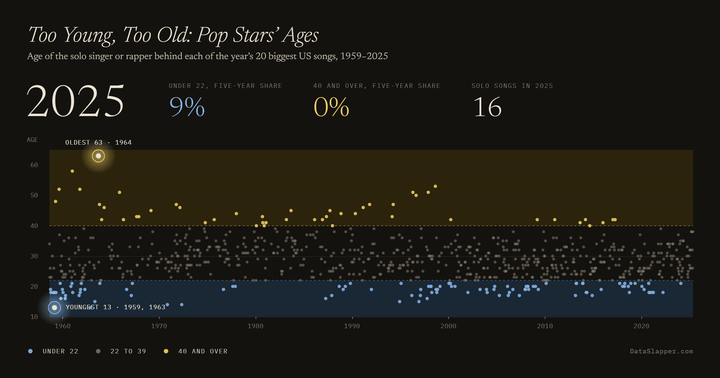
Too Young, Too Old: Pop Stars’ Ages, 1959–2025
The age of the solo star behind each of America's 20 biggest songs of the year, 1959–2025: teenagers and 60-year-olds in the 1960s, nobody 40 or over since 2017.
Updated 2025 -
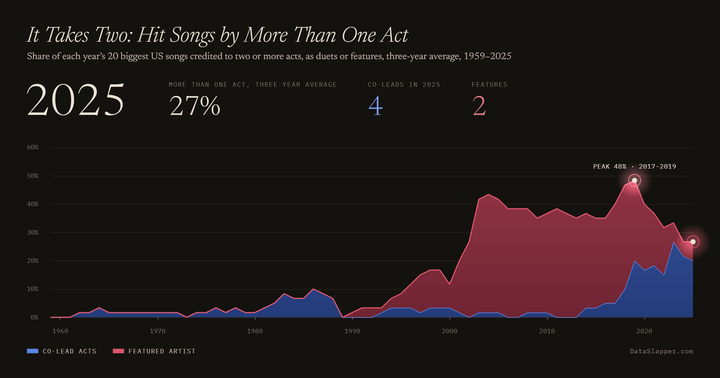
It Takes Two: Hit Songs by More Than One Act, 1959–2025
The share of America's 20 biggest songs each year credited to two or more acts, as duets or features, 1959–2025: rare in the 1960s, nearly half by the late 2010s.
Updated 2025 -
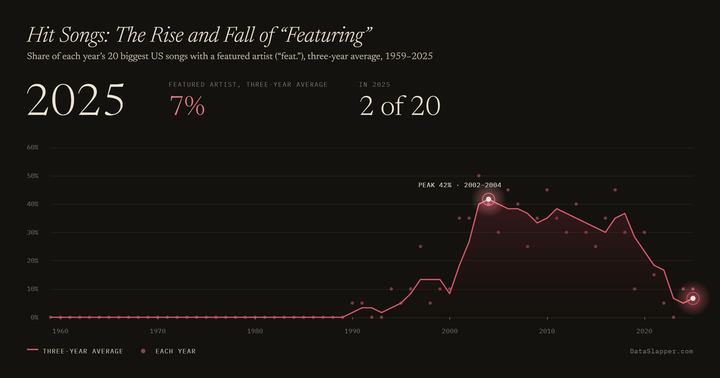
Hit Songs: The Rise and Fall of “Featuring”, 1959–2025
How many of America's 20 biggest songs each year credit a featured artist, 1959–2025: none before 1990, about four in ten in the early 2000s, and few today.
Updated 2025 -
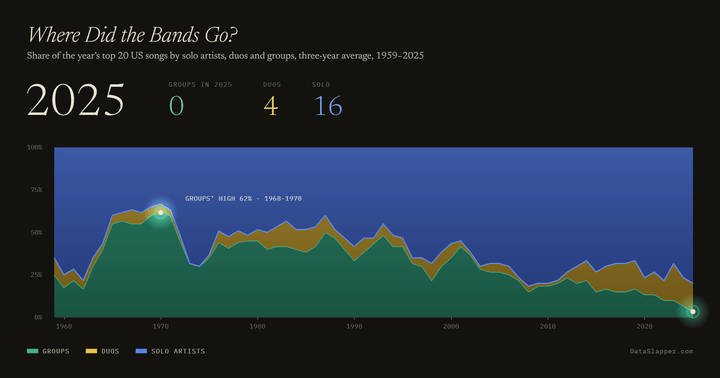
Where Did the Bands Go? 1959–2025
America's top 20 hits by solo artists, duos and groups, 1959–2025: groups had most of them in the late 1960s and none in 2025.
Updated 2025 -
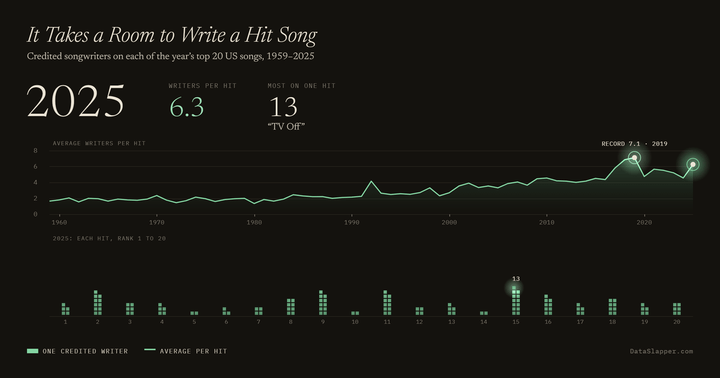
It Takes a Room to Write a Hit Song, 1959–2025
The credited songwriters on America's top 20 hits, 1959–2025, from under two per song in 1959 to more than six today.
Updated 2025 -
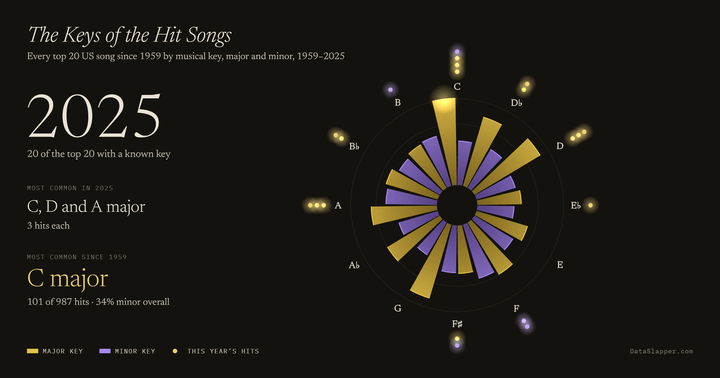
The Keys of the Hit Songs, 1959–2025
Every top 20 hit since 1959 on a wheel of the twelve keys, major and minor, building year by year; C major leads.
Updated 2025 -
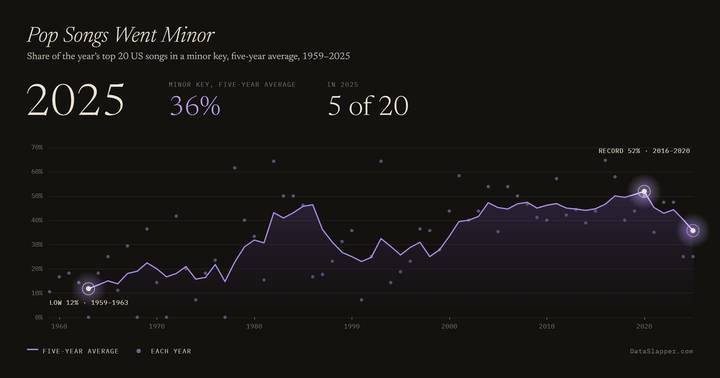
Pop Songs Went Minor, 1959–2025
The share of America's top 20 hits written in a minor key, 1959–2025, from about one in eight in the early 1960s to more than half in the late 2010s.
Updated 2025 -
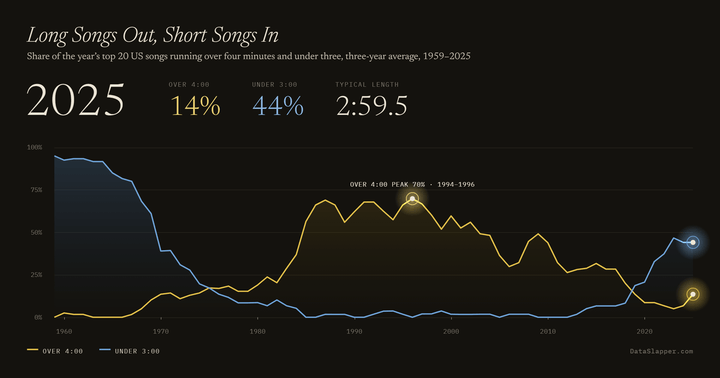
Long Songs Out, Short Songs In, 1959–2025
How long America's biggest hits run, 1959–2025: songs over four minutes rose to 70 percent in the 1990s, and songs under three minutes are back.
Updated 2025 -
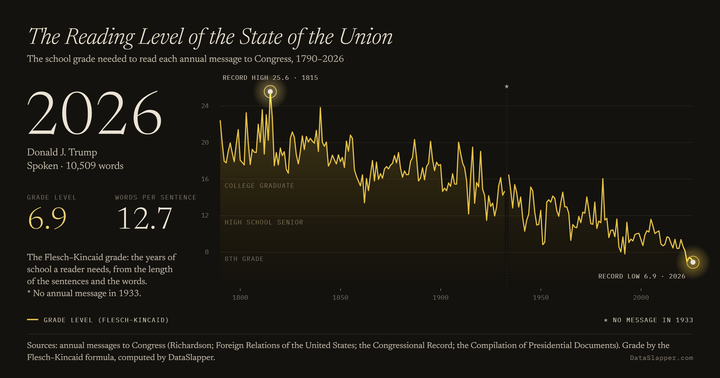
The Reading Level of the State of the Union, 1790–2026
The Flesch–Kincaid reading grade of every State of the Union message since 1790, from beyond a college graduate in the 1800s to 6.9 in 2026.
Updated 2026 -
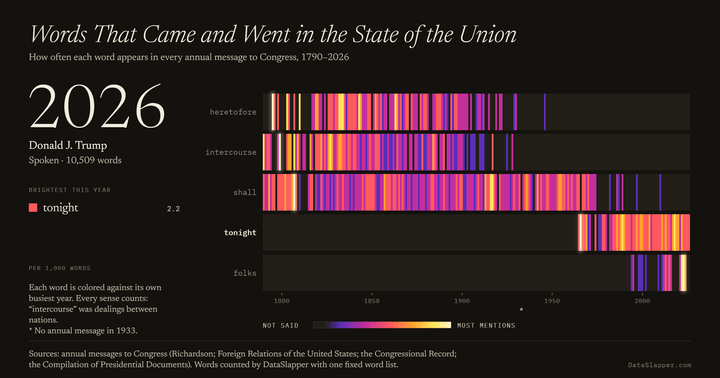
Words That Came and Went in the State of the Union, 1790–2026
How often five words, from heretofore and intercourse to tonight and folks, appear in every State of the Union message since 1790, as a grid that lights each word against its own busiest year.
Updated 2026 -
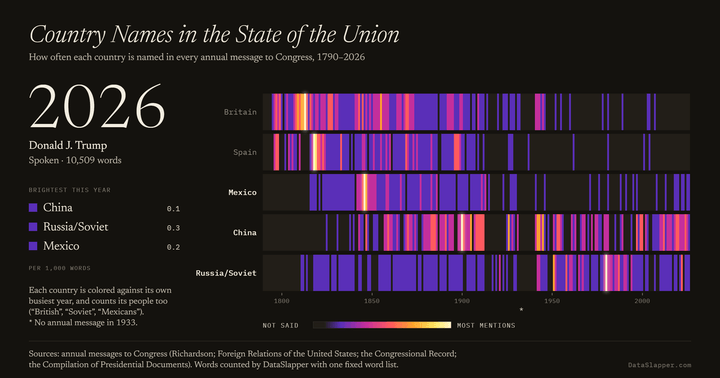
Country Names in the State of the Union, 1790–2026
How often Britain, Spain, Mexico, China and Russia are named in every State of the Union message since 1790, as a grid that lights each country against its own busiest year.
Updated 2026 -
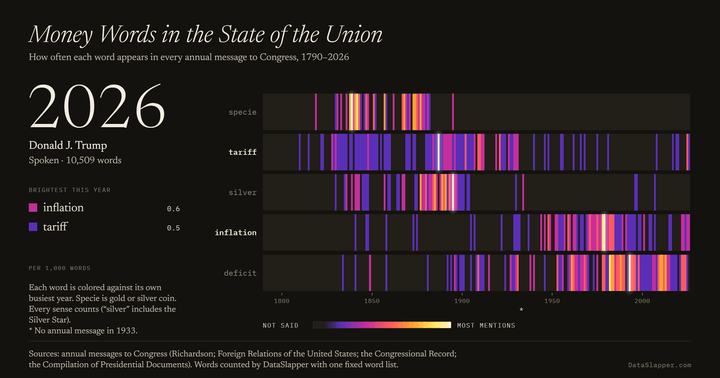
Money Words in the State of the Union, 1790–2026
How often five words, from specie and silver to inflation and deficit, appear in every State of the Union message since 1790, as a grid that lights each word against its own busiest year.
Updated 2026 -
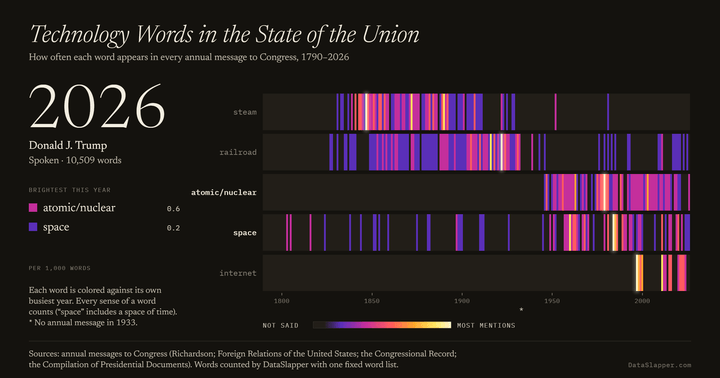
Technology Words in the State of the Union, 1790–2026
How often five words, from steam and railroad to space and the internet, appear in every State of the Union message since 1790, as a grid that lights each word against its own busiest year.
Updated 2026 -
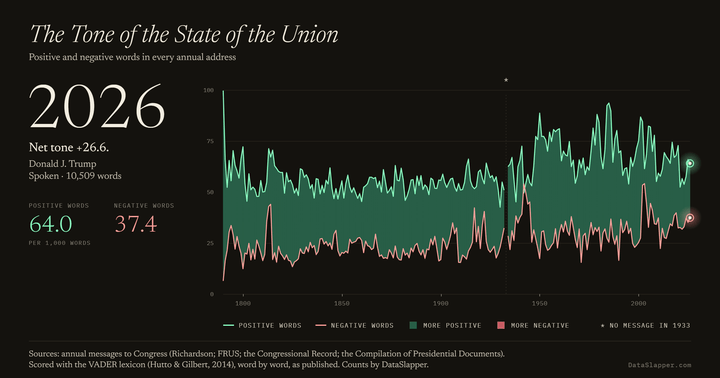
The Tone of the State of the Union, 1790–2026
Positive and negative words in every State of the Union message since 1790, as the VADER word list rates them, drawn as two lines with the gap colored by whichever leads.
Updated 2026 -
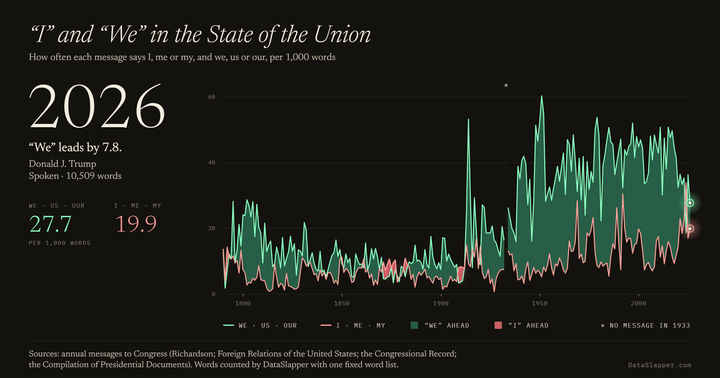
“I” and “We” in the State of the Union, 1790–2026
How often every State of the Union message since 1790 says “I” and how often “we”, as two lines with the gap colored by whichever leads.
Updated 2026 -
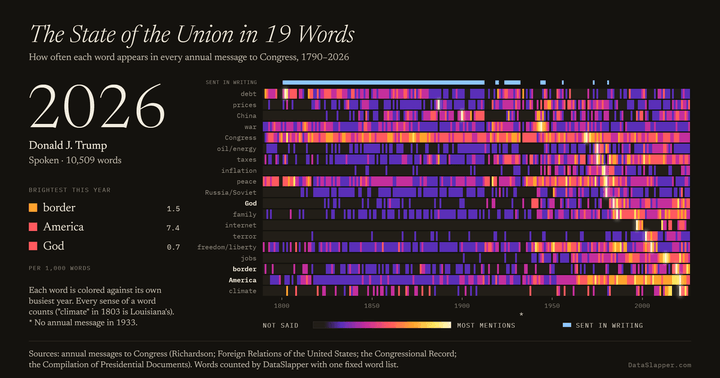
The State of the Union in 19 Words, 1790–2026
How often 19 words, from war and debt to jobs and climate, appear in every State of the Union message since 1790, as a grid that lights each word against its own busiest year.
Updated 2026 -
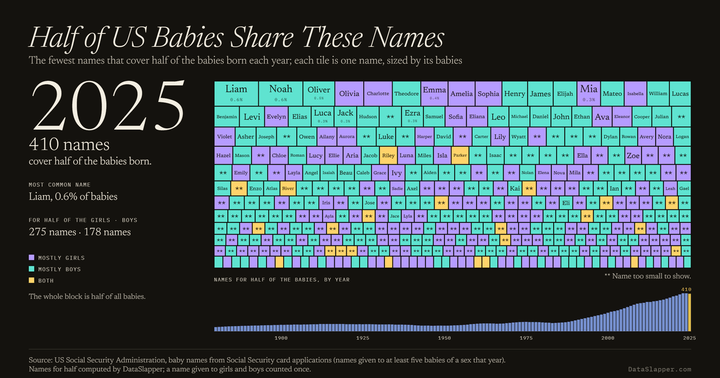
Half of US Babies Share These Names, 1880–2025
The fewest first names that cover half of US babies each year, from 45 in 1880 to 410 in 2025, as a mosaic of name tiles that glide into place.
Updated 2025 -
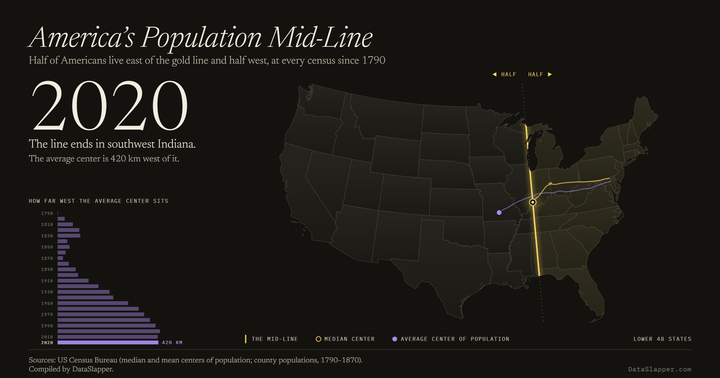
America's Population Mid-Line, 1790–2020
The line with half of Americans on each side, at every census since 1790 — from just east of Baltimore into southwest Indiana — as the average center runs off toward Missouri.
Updated 2020 -
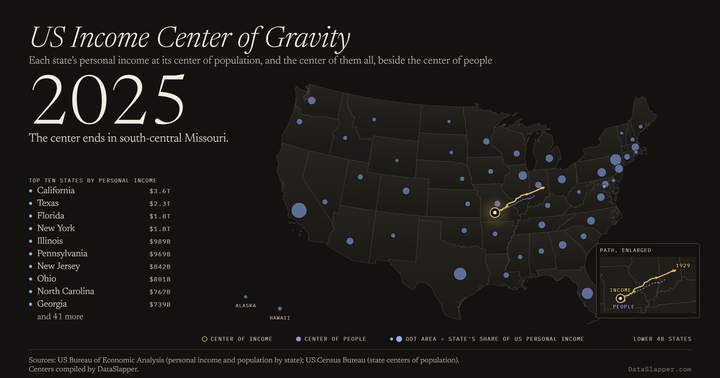
US Income Center of Gravity, 1929–2025
Where Americans' personal income centers each year, each state's income placed at its center of population, drifting from central Indiana to south-central Missouri and closing on the center of people, 1929 to 2025.
Updated 2025 -
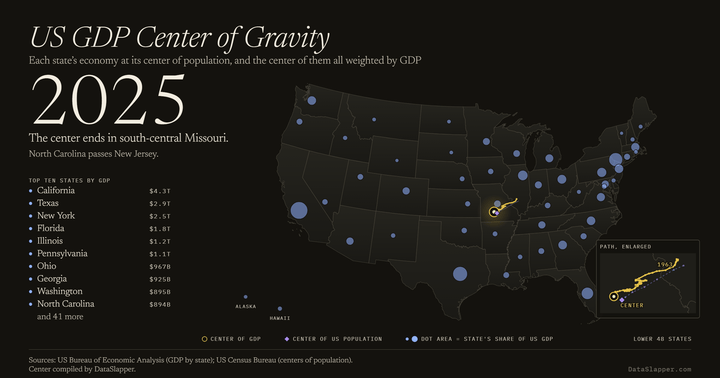
US GDP Center of Gravity, 1963–2025
Where America's economic output centers each year, each state's GDP placed at its center of population, drifting from south-central Illinois to south-central Missouri, 1963 to 2025.
Updated 2025 -
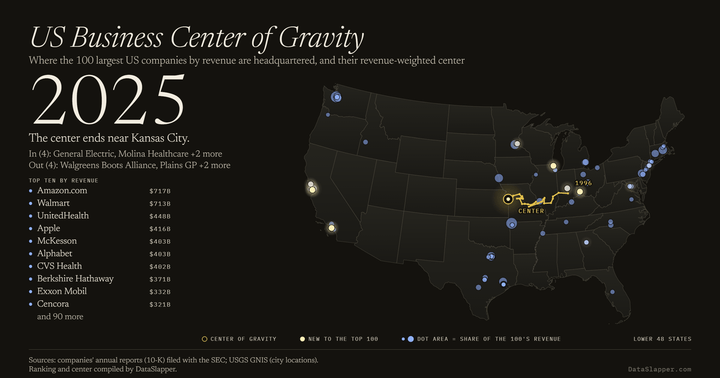
US Business Center of Gravity, 1996–2025
Where America's 100 largest companies by revenue are headquartered each year, and their revenue-weighted center drifting west to near Kansas City, 1996 to 2025.
Updated 2025 -
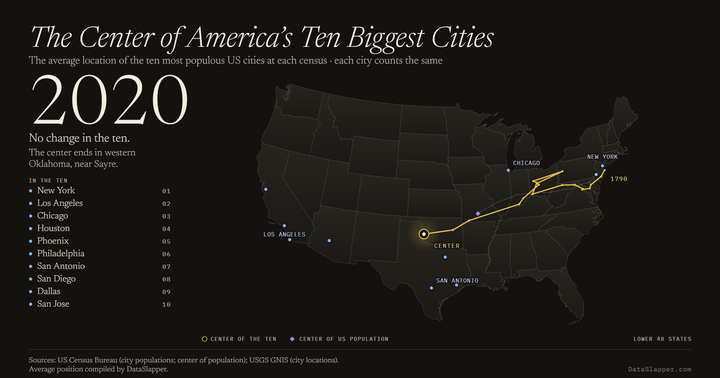
The Center of America's Ten Biggest Cities, 1790–2020
The average location of America's ten most populous cities at each census, from off the New Jersey shore in 1790 to western Oklahoma in 2020.
Updated 2020